Understanding Who Saved Humanity: A Restorationist History
This study was written by Neville Roy Singham, chair of Tricontinental: Institute for Social Research’s advisory board. The author acknowledges with gratitude the crucial support of the Tricontinental team, spanning multifaceted research, comprehensive statistical analysis, technical infrastructure, and the production of this publication. An earlier version of this study was published in Guancha (观察者网), whose editors provided valuable advice for further research and analysis. The author takes full responsibility for any errors or omissions in this work.

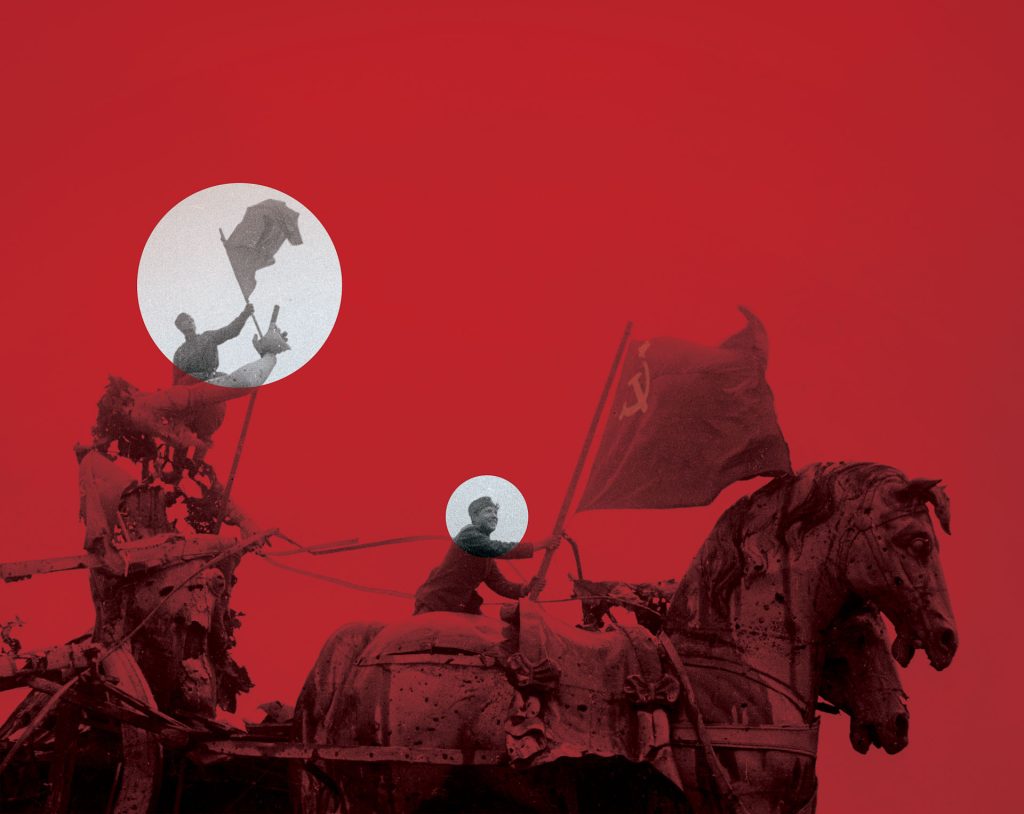
As we commemorate the 80th anniversary of the victory in the World Anti-Fascist War (WAFW), the Western powers spin their familiar tale: US industrial might and British resolve saved the world from fascism. This is a lie. The truth burns in the numbers: while the Western powers calculated their economic advantage, the Soviet and Chinese peoples paid in blood. Fascism was defeated not by Anglo-American capital but by socialist leadership and mass heroism – a brilliant strategy from Moscow and Yan’an, unbreakable resilience from workers and peasants who refused to surrender, and a sacrifice that saved humanity from slavery.
The real war began not in 1939, when Adolf Hitler invaded Poland, but in 1931, when Japan invaded Northeast China (东北).1 For ten years, China fought mainly alone except for Soviet aid, which included planes and pilots. Britain, France, and the United States sent only minimal aid to China from 1937 to 1941. Washington and London would rather count profits.
Throughout the same decade, the Soviet Union raced against time, force-marching industrialisation while knowing invasion was imminent. Josef Stalin’s February 1931 speech to industrial managers predicted with terrible precision: ‘We are fifty or a hundred years behind the advanced countries. We must make good this distance in ten years. Either we do it, or we shall go under’.2 Ten years later – June 1941 – the Wehrmacht invaded. The USSR had exactly one decade to prepare for a war everyone knew was coming. The preparation was not enough to prevent the initial catastrophe, but it was exactly enough to enable recovery.
The Atlantic powers’ initial strategy until just before their entry into the war was simple and cynical: let fascism and communism destroy each other.
1. The West’s Deliberate Delay: A Strategy of Treachery
The timeline of Western betrayal speaks for itself. From 1931 to 1941, as Japan carved up China, Western banks maintained their offices in Tokyo, Western oil fuelled Japanese warships, and Western scrap metal became Japanese bullets.3 When full-scale invasion erupted in 1937 – the Rape of Nanjing, the terror bombing of Chinese cities – the Allied imperialists’ response was to sell more oil to Japan. The US provided 80% of Japan’s petroleum until 1941.4
This was not isolation but calculated provision – fascism executing what the failed White Encirclement could not accomplish. By 1941, 250 US corporations operated in Nazi Germany.5 Thomas Watson of IBM automated the Holocaust while maintaining personal friendships with both US President Franklin D. Roosevelt and Secretary of State Cordell Hull.6 General Motors’ German subsidiary Opel produced Wehrmacht trucks until 1944, with GM later claiming a $22.7 million tax write-off for its ‘abandoned’ Nazi operations.7 The US continued strategically to be economically, politically, and militarily committed to the destruction of the Soviet Union.
Western historiography attributes this late US entry to ‘isolationism’. This ahistorical view ignores documented precedent: during the White Encirclement of 1919, the US deployed 11,500 troops to Russia – 4,500 to Arkhangelsk and 7,000 to Vladivostok – alongside British, French, and Japanese forces, fighting the Red Army directly with over 500 US casualties.8 US President Woodrow Wilson also provided more than $50 million in military support to White armies. When direct military intervention failed to nip socialism in the bud, the strategy shifted. US policymakers consistently favoured right-wing autocrats who promised stability and anti-Bolshevism over democratic movements. This policy produced open support for European fascism. In 1933, President Roosevelt stated that he was ‘deeply impressed by what [Benito Mussolini] has accomplished and by his evidenced honest purpose of restoring Italy’.9
The first British strategy, even when it entered the war, was to let Hitler and Stalin exhaust each other. When Germany invaded Poland in September 1939, Britain and France, while declaring war on Germany, did nothing – the ‘Phoney War’ lasted eight months while they hoped Hitler would turn east. Winston Churchill’s anti-communist hatred defined his career. In 1919, he sought to ‘strangle Bolshevism in its cradle’.10 By 1945, with Hitler barely dead, he planned Operation Unthinkable – using Wehrmacht forces to attack the Soviet Union.11
Churchill’s genocidal impulses targeted communists and colonised peoples equally. His racial violence was extensive: celebrating killing ‘savages’ at Omdurman (1898), supporting concentration camps that killed forty-eight thousand Africans and Boers, and advocating poison gas for Iraqi ‘uncivilised tribes’ (1920). By 1942, as Bengal starved, he told Leo Amery, the secretary of state for India: ‘I hate Indians. They are a beastly people with a beastly religion’. When Amery begged for famine relief, Churchill replied that Indians ‘breed like rabbits’.12 Three million Indians died while Britain exported Bengal’s rice. After Churchill’s India tirade, Leo Amery wrote in his diary: ‘I couldn’t help telling him that I didn’t see much difference between his outlook and Hitler’s’.13 Today, Britain venerates this man, who differed from Hitler only in his victory.
The US entered the war only when it was directly attacked at Pearl Harbor (Hawaiʻi) – a decade into Japan’s war against China. The Second Front, promised for 1942, was not delivered until June 1944 – 730 days late, after the battles at Stalingrad (1942–1943) and Kursk (1943) had already broken the Wehrmacht’s spine.14 By D-Day, the Red Army had already destroyed the myth of German invincibility and Nazi defeat was already determined. The US and Britain had to invade continental Europe in 1944, by which time the Soviet Union had already guaranteed the defeat of Germany, to ensure that the socialist USSR did not liberate the entire continent, threatening capitalism in Western as well as Eastern Europe.
US priorities were clear: better a fascist Europe than a socialist one. Better Japanese domination of Asia than Chinese liberation and the expansion of socialism. The metropolitan powers’ hatred of communism and love of their colonies outweighed their anti-fascist principles.
2. When Inter-Imperialist Rivalries Mattered
The Western strategy towards Nazi Germany followed a logic established in 1917. When British intervention failed to overthrow the Bolsheviks, geopolitical theorist Halford Mackinder – appointed high commissioner to organise support for the White Army – recommended that German rearmament, though dangerous to British interests, was essential as a bulwark against Bolshevik control of Eastern Europe. The Treaty of Versailles (1919), as economist Thorstein Veblen observed, was fundamentally ‘a compact for the reduction of Soviet Russia’ – a goal that, while ‘not written into the text of the Treaty’, was nonetheless ‘the parchment upon which the text was written’.15 This remained Western strategy through 1945: contain and destroy the USSR, even if it meant enabling fascism.
At Munich in 1938, British Prime Minister Neville Chamberlain formalised this strategy with Hitler: Germany would receive a ‘free hand’ in Eastern Europe to attack the USSR in exchange for respecting British imperial interests. Yet inter-imperialist rivalry imposed limits. Britain wanted Hitler to destroy the Soviet Union but feared that unchecked German expansion would threaten the British Empire itself – the contradiction explains both the collusion and Britain’s eventual war declaration.
When Britain sent negotiators to Moscow by slow merchant ship, Admiral Reginald Drax arrived without written authority – the message was unmistakable: no real alliance with communists.16 Foreign Secretary Halifax praised Hitler in a 1937 meeting as a ‘bulwark against Bolshevism’, while a 1939 government-endorsed pamphlet by Lord Lloyd of Dolobran identified Hitler’s ‘final apostasy’ not as invading Poland but as signing the German-Soviet pact—‘the betrayal of Europe’.17 Facing isolation, Stalin signed the Molotov-Ribbentrop Pact in August 1939 – not from choice but from necessity created by Western collusion with Hitler.
In the following twenty-two months (September 1939–mid-June 1941), the Soviet Union more than tripled its army from 1.6 to 5.3 million, doubled its tank production from 2,794 units in 1940 to 6,590 in 1941 (including 1,225 T-34s), and moved entire industries eastward. US attachés reported massive industrial transfers to the Urals by late 1940, before the invasion. The USSR pushed its borders 200–300 kilometres west, trading space for time. Stalin knew war was coming.18
In May 1940, Churchill became prime minister as France and Britain’s army fled Dunkirk. Foreign Secretary Viscount Halifax proposed negotiating peace through Mussolini – Germany could have Europe if Britain kept its empire.19 Churchill opposed this plan, not from principle but out of arithmetic. If Germany were allowed to conquer Europe, its strength would mean it could later overturn any peace agreement and defeat Britain. To take only one example, the Caucasus produced 25.4 million tonnes of oil annually – 80% of Soviet output. Germany had 3.1 months of oil reserves.20 If Germany’s Chancellor Adolf Hitler seized Soviet resources, Britain faced certain defeat.
By continuing the war, Churchill forced Germany to maintain forty-nine divisions in Western Europe and Norway – 24% of total Wehrmacht strength that could not be deployed against the USSR.21 While significant, this did not prevent the assembly of history’s largest invasion force.
Germany launched Operation Barbarossa with 153 German divisions totalling over 3 million troops. The Imperial War Museum, Britain’s unrepentant national museum, calculates that 80% of the German Army was committed to this invasion.22 Additionally, 36 Axis-allied divisions joined the assault – 16 Finnish, 15 Romanian, 3 Italian, and 2 Slovak – bringing the total to 189 divisions. This force of nearly 4 million troops represented the overwhelming concentration of Axis military power. The Eastern Front was not another theatre of war but the primary site of fascist aggression, where the Wehrmacht deployed its best units, most experienced commanders, and maximum strength.
This was the largest military invasion in human history. Yet the Soviet Union defeated this unprecedented assault through its own strategic depth, mass mobilisation, and industrial relocation.
Facing extremely powerful adversaries, Stalin and Mao Zedong took into account how to exploit inter-imperialist rivalries that became so intense by the 1940s. These inter-imperialist contradictions – contingent moments when empire’s internal conflicts accidentally serve revolutionary forces – are usually brief and unreliable. They emerge unpredictably from capitalism’s internal contradictions, must be recognised and leveraged when they appear, but never mistaken for a strategic alliance.
3. Economic Power in 1941: The Myth of Western Might
In 1941, world GDP totalled approximately $4.5–$5 trillion (in 1990 international dollars). Those with the greatest capacity to fight fascism deliberately chose not to do so.
As documented by economic historian Mark Harrison in his book The Economics of World War II (1998), the Anglo-American imperial core commanded approximately 30.2% of world GDP. The US alone controlled $1,094 billion – roughly 22–24% of global output – while maintaining comfortable neutrality a decade into the WAFW. The British Empire added $344 billion (7–8% of world GDP), extracted from 427 million colonial subjects. In total, this camp (the US and its territories and the British Empire as defined by the British in 1941) controlled 28.6% of the world’s population. The US remained neutral until it was attacked. Britain declared war but prioritised empire.
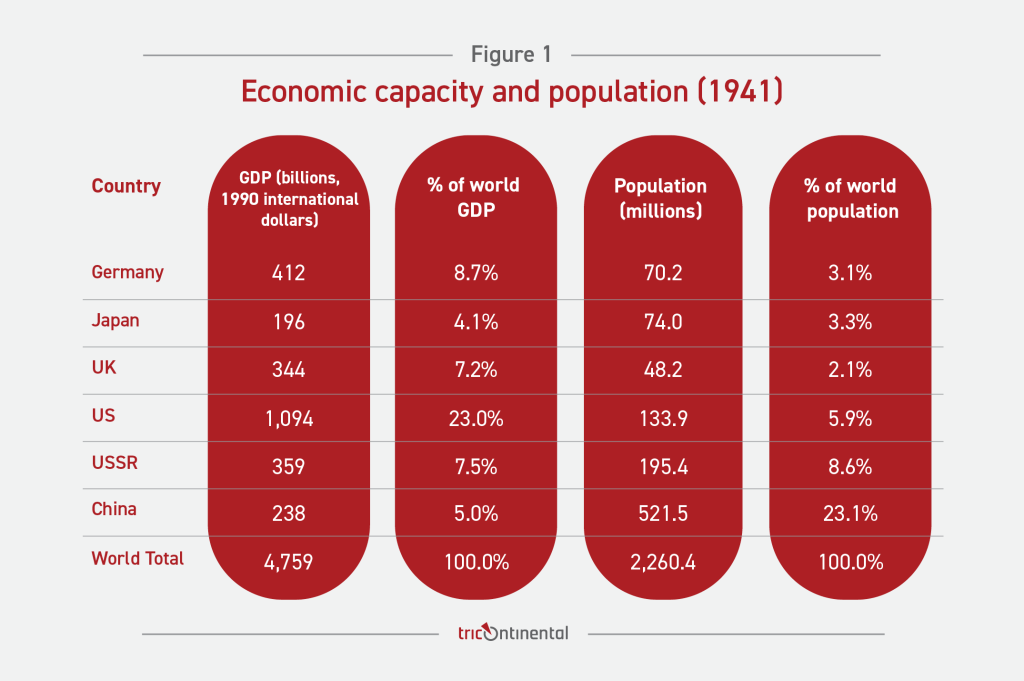
Sources: Population data mainly from Maddison (2010); GDP data mainly from Harrison (1998), p. 10, table 1.3; USSR population for 1941 from Statista (2025); China and world-total GDP are corroborated estimates by Tricontinental: Institute for Social Research. See Section 2 for full methodology.
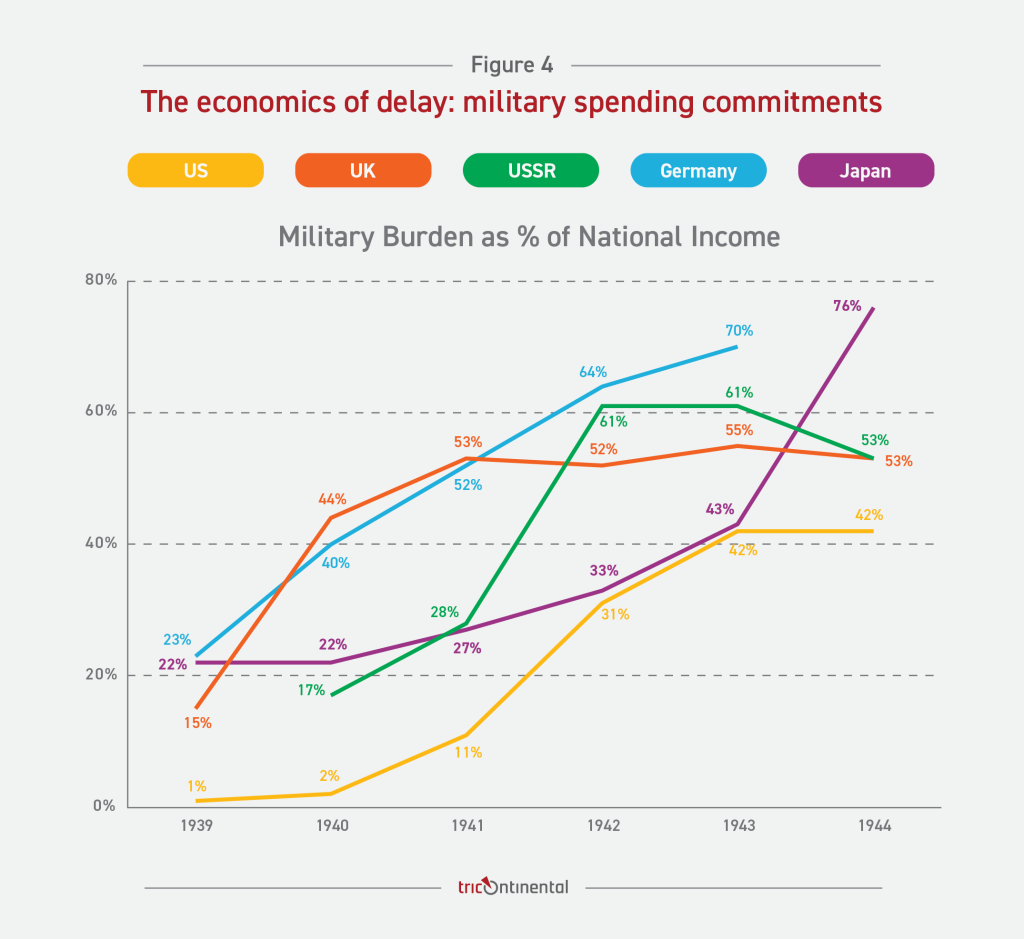
The US dedicated just 11% of its GNP to military spending before Pearl Harbor. The US military in December 1941 fielded only 1.62 million troops from a population of 133.9 million – just 1.2% of its population was under arms. By contrast, Germany had 7.3 million troops from a population of 70.2 million (10.4%), and the Soviet Union had 7.1 million from a population of 195.4 million (3.6%) by year’s end. Britain, despite declaring war in 1939, had reached 53% of national expenditure on military efforts, but much of this went to protecting empire, not fighting fascism directly. In North Africa, British forces fought to maintain colonial control, not liberate populations. Churchill’s quote: ‘I have not become the King’s First Minister to liquidate the British Empire’. 23
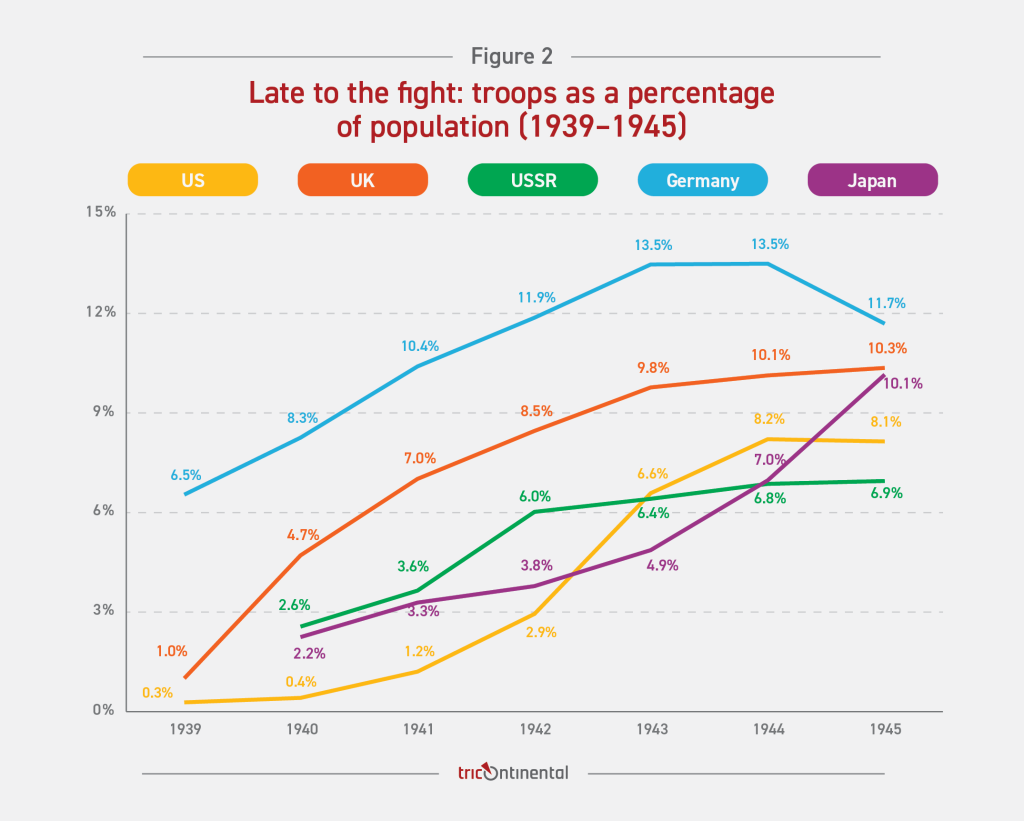
Sources: Troops data from Harrison (1998), p. 14, table 1.5; population from Maddison (2010) and Statista (2025). See Section 2 for full methodology.
The fascist-imperialist Axis had weaponised its economies. Germany devoted 52% of GNP to military spending in 1941, reaching 70% by 1943, and fielded 3 million troops for the Barbarossa invasion (1941). Other Axis powers fielded an additional 500,000 to 700,000 troops (Romania, Finland, Hungary, Italy, and Slovakia), thus allowing Hitler to claim that this was a pan-European operation. It was and remains the largest military invasion in human history. Japan maintained 1.7 million soldiers in China with a military burden of 27% of GDP after a decade of continuous warfare.
The Axis, led by Germany, Italy, and Japan, also included pact signatories Hungary, Romania, Slovakia, Bulgaria, and Croatia, with Finland as a co-belligerent. The Axis powers and the territories they controlled commanded approximately 20.1% of world GDP. This figure was composed of contributions from Germany proper ($412 billion), the annexed territory of Austria ($29 billion), Japan ($196 billion), Italy ($144 billion), the heavily industrialised occupied territory of France ($130 billion), and the other members (approximately $47 billion). In addition to this, ‘neutral’ collaborators, including Switzerland, Sweden, Spain, and Portugal, contributed a separate 2.6% of world GDP to the Axis economic sphere.
The socialist camp – the Soviet Union and Chinese Communist base areas that would tie down 60% of Japanese forces – represented approximately 8% of world GDP with $359 billion. By mid-1941, with German armies deep in Soviet territory, even this was shrinking. Yet the Soviets had mobilised 28% of GNP for military expenditure. The Red Army expanded the army’s peacetime strength from 1.5 million on 1 January 1938 to over 5 million in June 1941.24
China’s tragedy was written in numbers. Controlling 23% of the world’s population (490–525 million people), China generated only around 5% of world GDP after its century of humiliation and a decade of Japanese devastation. Official data from the Kuomintang (KMT) government is scarce. In 1937, the year of full escalation of Japanese aggression, the estimate for KMT troops was 1.7 million; by 1941, the US military estimated 3.8 million troops. A scholarly monograph on Chinese military history estimated that there were 6 million KMT troops in the summer of 1941.25 The people’s army, led by the Communist Party of China (CPC), grew from 56,000 in 1937 to around 440,000 in 1941 and 1.3 million in 1945.26 With little domestic arms production, military capacity depended on foreign supplies, especially from the Soviet Union. China had people but few weapons, courage but little industry, resistance but scant resources.
The pattern of foreign aid exposed priorities. Between October 1937 and June 1941, while the US watched, the Soviet Union provided China with over $250 million in credits, 1,235 aircraft, thousands of artillery pieces, tens of thousands of machine guns, as well as ammunition and supplies.27 The Soviets sent more than 2,000 pilots – 200 of whom died defending Chinese cities – and military advisers.28 While the USSR was fighting for survival, it still managed to send aid that represented 0.07% of Soviet GDP annually. Soviet pilots flew combat missions over Nanjing, Wuhan, and Chongqing. Before Pearl Harbor, the US provided almost nothing despite commanding 22–24% of world GDP.
Even after entering the war, China received just $632 million in Lend-Lease aid (1941–1945) while Britain, along with its two white settler states (Australia and New Zealand), received $25.8 billion of the $30.3 billion assigned by the US to the ‘British Empire’.
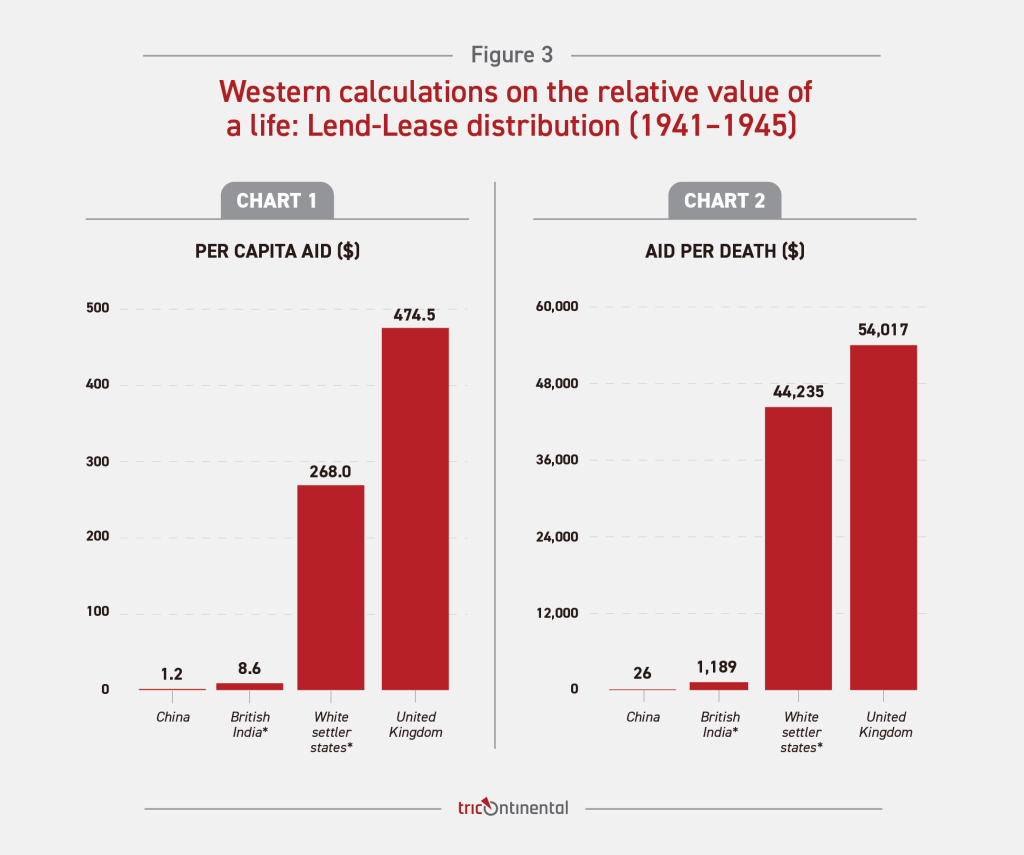
Sources: Lend-Lease aid numbers from US Department of State (1945), p. 14, table 2, and pp. 42–43, table 25; population data from Maddison (2010); China death data from Bian (2012), pp. 401–405; India death data from Sen (1977), p. 36. See Section 2 for full methodology.
*‘British India’ here refers to India and today’s Pakistan and Bangladesh. The Lend-Lease aid and population numbers for British India and Ceylon (now Sri Lanka) are included here.
*‘White settler states’ refers to Australia and New Zealand.
Chart 1: Per capita aid: whites received $442.3 per person; non-whites (China, British India, and Ceylon) received $4.4 – a 101:1 ratio
Chart 2: Per death valuation: white deaths ‘valued’ at $52,913; non-white (China, British India) deaths at $155 – a 341:1 ratio
The British Empire in 1945 (as defined by the US in the Lend-Lease Programme) consisted of 58.3 million whites and 443.1 million non-white subjects. The mathematics was simple: the US directed 85.1% of the British Empire’s Lend-Lease aid to whites, who comprised only 11.6% of the Empire’s population.
From 1945 to 1948, the US provided at least $1.4 billion to Chiang Kai-shek’s government, with over half being military aid – double the $700 million in military aid given during the WAFW – excluding substantial surplus property sales.29 Additional aid continued through 1949 when the Nationalists lost the civil war. The formula: minimal help against Japan, maximum support against communism.
Poignant observations were made by two articles in Historical Review published by the China Academy of Social Sciences in August 2025:
First: Overall, in the early stages of the full-scale War of Resistance, the Soviet Union’s vital assistance to a China engaged in an arduous struggle was like ‘offering fuel in snowy weather’.
Second: After the end of the Anti-Japanese War, the US actively aided and supported the Kuomintang reactionaries in launching a civil war and signed the seemingly reciprocal but actually unequal ‘Sino-American Treaty of Friendship, Commerce, and Navigation’ with the Nationalist government, aiming to maintain influence over China through economic control and military intervention.
The economic arithmetic was clear: the Anglo-Americans had the money but would not fight. The fascists had militarised everything. The socialists had little but gave all.
Source: Harrison (1998), p. 21, table 1.8. See appendix for a verbatim transcript of the source data.
4. China’s Fourteen-Year Resistance: The Forgotten Foundation of Victory
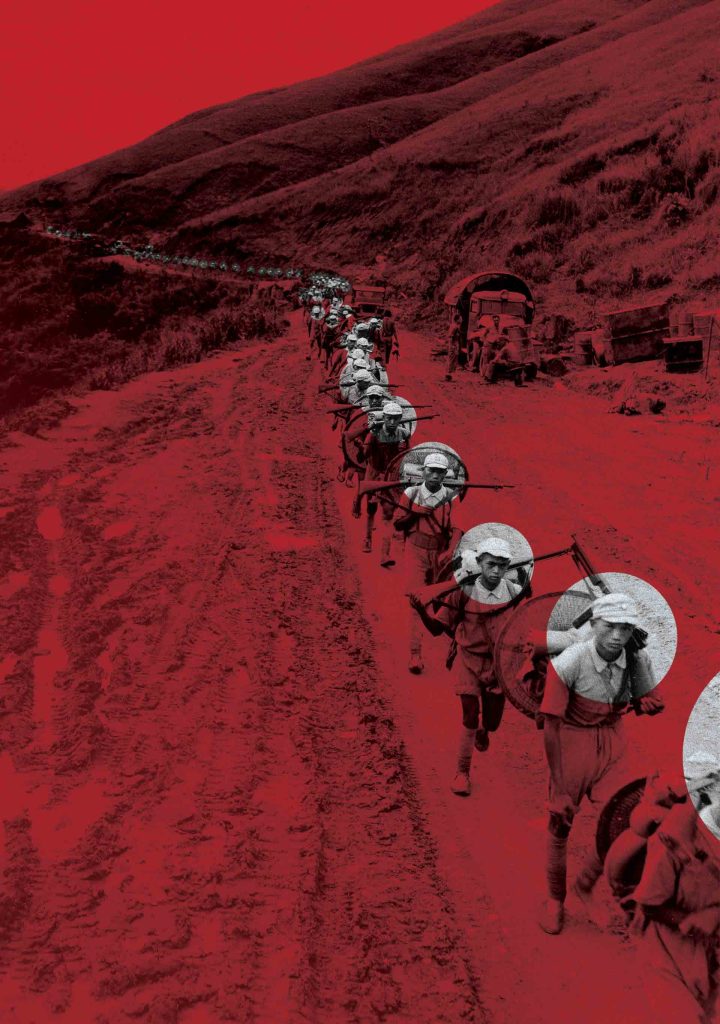
China’s fourteen-year resistance against Japanese imperialism tied down the bulk of Japanese land forces throughout the war. Chinese forces prevented over half a million Japanese soldiers from attacking the Soviet Far East or sweeping through the Pacific.30 As the war progressed, increasing numbers of KMT soldiers defected to the Communist forces, strengthening the guerrilla resistance. Every Chinese soldier who held a position with obsolete weapons and an empty stomach prevented a Japanese soldier from fighting elsewhere. China’s military weakness made its resistance more heroic, not less.
The Red Army soldiers who fled Ruijin, site of the first Chinese Soviet Republic, crossed frozen mountains in straw sandals in 1935 while KMT bombers with US engines hunted them from above.31 Blood froze in their footprints. Toes turned black and fell off. Those who survived became the core of guerrilla forces that by 1940 tied down 60% of Japanese troops.
The following numbers shatter every myth about who won this war:
Sources: USSR data from Andreev et al. (1993); China data from Bian (2012), pp. 401–405; India data from Sen (1977), p. 36. See appendix for full methodology.
The deployment patterns expose the truth: socialist forces were desperately engaged in existential struggle while capitalist forces carefully husbanded their strength for post-war advantage.
5. The Blood Price: Who Really Defeated Fascism
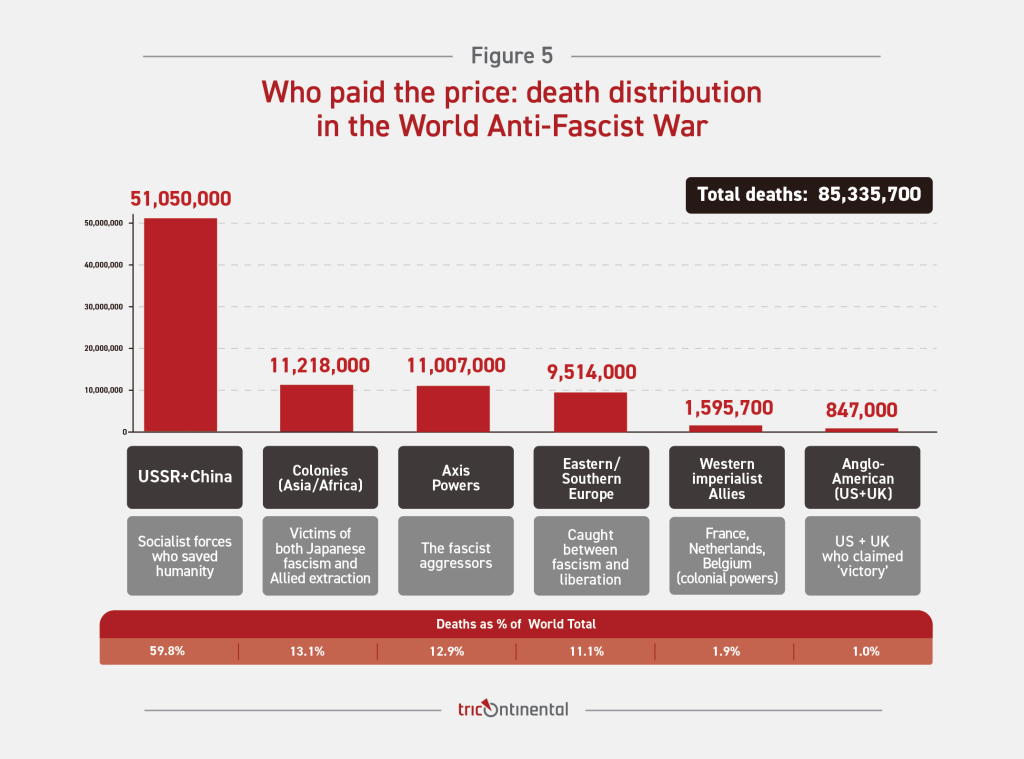
The global struggle against fascism killed 85 million human beings.
That is 3.8% of humanity: dead.
Sources: USSR death data from Andreev et al. (1993); China death data from Bian (2012), pp. 401–405; French Indochina population from Budge (2014) and death data from The National WWII Museum New Orleans (n.d.); other population data from Maddison (2010). See appendix for full methodology.
Who paid this price reveals who saved the world. The arithmetic will destroy every lie that the late arrivals have said about this war, not as statistics but as accusations. Every number is a crime – every percentage a verdict.
59.8% socialists dead, 13.1% colonised peoples dead – only 1% Anglo-Americans dead.
This was not their war. It was their profit.
Sources: USSR data from Andreev et al. (1993); China data from Bian (2012), pp. 401–405 and p. 442. See appendix for full methodology.
But even these deaths tell only half the horror. The wounded – those who survived maimed, traumatised, broken – vanished from Western history. We restore them here: thirteen to eighteen million Soviets wounded – ignored. Each lived with pain that Washington and London never felt. Every Western soldier wounded became a casualty worthy of pensions, medals, remembrance. The eleven to twenty-six million wounded Chinese vanished from history as if they never existed, never suffered, never mattered.
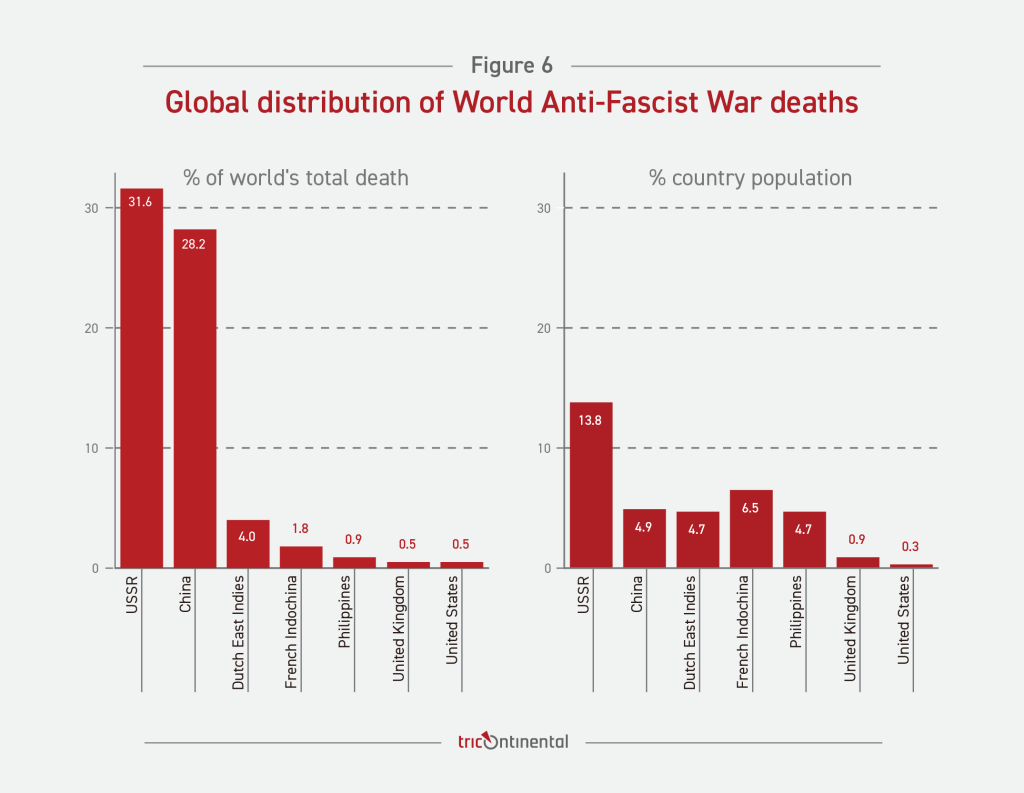
The arithmetic convicts: socialist forces suffered 59.8% of all WAFW deaths with less than 15% of world GDP. In Korea, 99% of deaths were Korean or Chinese. In Vietnam, 99% of the deaths were Southeast Asian. The pattern screams across three wars, across five decades, and across continents – those with nothing saved humanity while those with everything preserved their strength for the post-war plunder.
6. The Soviet Union Destroyed Fascism in Europe
The Red Army eliminated or decisively defeated the Wehrmacht’s strength in battles that decided humanity’s fate: Moscow, Stalingrad, Kursk, and Berlin. The price: 27 million Soviet deaths.32 That’s 13.8% of the Soviet population based on a population of 196.0 million in 1940. That is 1.2% of the entire world’s population wiped out because they stood between fascism and the rest of us.
These were not abstract statistics. Whole villages where no men between the ages of eighteen and fifty survived. The Soviet Union inflicted 9 million of Germany’s 11.1 million military casualties. This victory was partly possible because China’s resistance prevented Japan from attacking the Soviet Far East during 1941–1942 when Moscow hung by a thread. As President Vladimir Putin acknowledged in 2025, China’s resistance was ‘one of the crucial factors that prevented Japan from stabbing the Soviet Union in the back during the darkest months’.
Among Soviet deaths were 1.3 million Jews murdered in the Holocaust’s eastern killing fields, 3.3 million prisoners of war deliberately starved in German camps, and millions of civilians killed in accordance with Generalplan Ost (Master Plan for the East) and other Nazi racial policies targeting ‘subhuman’ Slavs.33
7. China’s Demographic Catastrophe
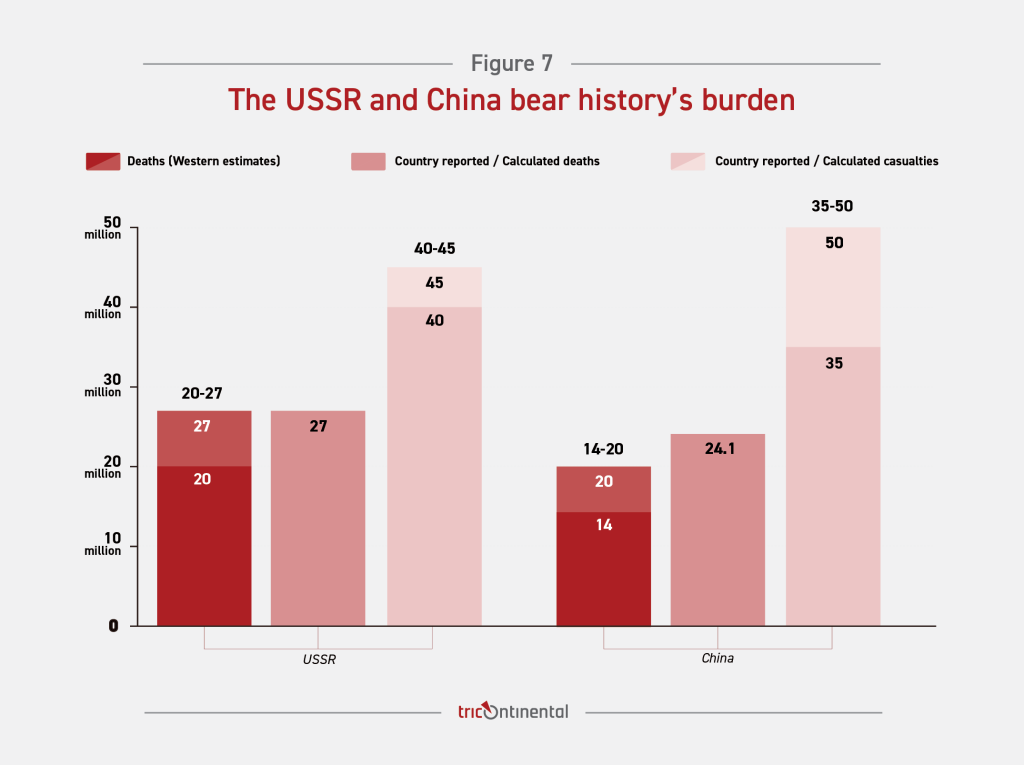
At least 23.6 million deaths were documented from 1937 to 1945 alone – 20.6 million direct deaths from combat and massacres, plus 3 million from the 1942 Henan famine caused by the Japanese disruption. Before that, from 1931 to mid-1937, the Japanese invasion also resulted in an estimated 450,000 deaths. The total documented deaths from 1931 to 1945: 24.05 million. With wounded included, total casualties reached 35 million. However, even this staggering figure understates the catastrophe. When including the 15 million who were never born because of the war’s destruction, China’s total population loss exceeded 50 million. The West acknowledges perhaps 15–20 million dead, ignores the wounded entirely, and erases the demographic hole that took generations to fill.34
The forced-labour system added another dimension to this genocide: from 1935 to 1945, 20% of the 11.5 million forced labourers in Northeast China died (2.3 million deaths). Among the 38,935 forced labourers shipped to Japan, 17.5% were killed in the emperor’s homeland, according to Chinese Academy of Social Sciences historian Bian Xiuyue.35 This research documents the genocide in precise terms, not with vague estimates.
The Western insistence on counting only deaths performs a double erasure. When 35 million Chinese were killed or wounded, focusing only on the West’s understated count of 20 million or fewer deaths erases at least 11 million wounded people whose lives were destroyed by Japanese aggression.
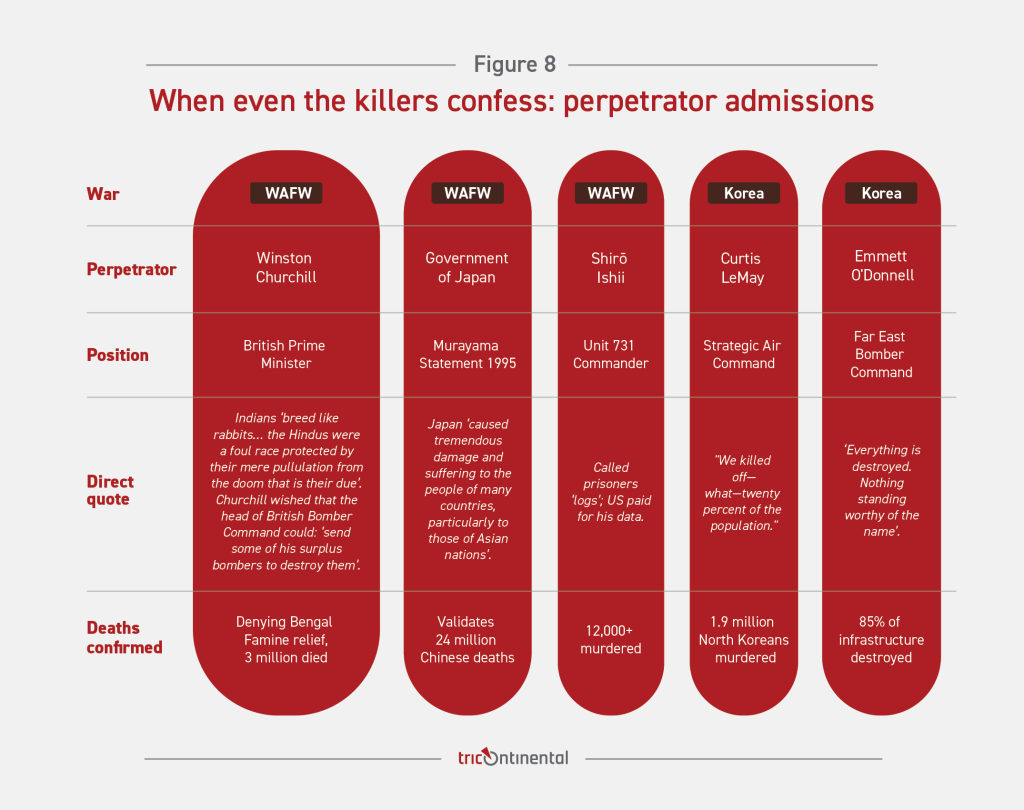
China’s 2015 government survey, involving 600,000 participants, documented systematic extermination through multiple methods. The Nanjing Massacre: 300,000 killed in six weeks and an estimated 20,000–80,000 rapes.36 Japan’s ‘Three Alls’ campaign – ‘Kill all, burn all, loot all’ – turned entire provinces into graveyards. Even regular POW camps revealed a national chauvinism extermination policy: Japan killed 99.9% of Chinese prisoners but only 27.1% of Western POWs.37
8. The Colonial Holocaust: Eleven Million Erased
While the imperial powers preserved their strength, their colonies bled. A total of 11.2 million colonial subjects died – more than ten times the total Anglo-American war death toll.
The Bengal Famine of 1943 killed 3 million Indians through British policy. While Bengalis starved, Britain exported rice from Bengal and denied relief ships.38 Churchill told his private secretary that ‘the Hindus were a foul race protected by their mere pullulation from the doom that is their due’. He wished that Air Chief Marshal Arthur Harris, head of the British Bomber Command, could ‘send some of his surplus bombers to destroy them’.39
The Dutch East Indies lost 3.4 million people – 4.7% of the population. Both colonial powers killed them – the Dutch through centuries of extraction that left them defenceless, the Japanese through forced labour, starvation, and systematic violence.
In Java alone, 1.8 million excess deaths occurred between 1944 and 1945. The rōmusha forced-labour system sent 300,000 Indonesians overseas; only 77,000 returned.40 On the Sumatra Railway alone, 17,000 of 22,000 Javanese labourers died – a mortality rate of 77%.
French Indochina: 1.5 million deaths – 6.5% of the population. The 1944–1945 famine killed 1–2 million Vietnamese through the combined extraction of Japanese requisitions and continued French colonial administration.
Burma: 270,000 to perhaps as high as 1 million dead under Japanese occupation while Britain fled, destroying oil fields but abandoning the Indian labourers and Burmese civilians who had no means of escape. The Thailand-Burma Railway (402 kilometres) killed 215 people per kilometre of track laid: 31 Western POW deaths per kilometre, 184 Asian labourer deaths per kilometre – a six-fold racial calculus.41 The shorter Kra Isthmus Railway (90 kilometres) had an even higher mortality rate of 537 deaths per kilometre (Huff, 2020), constructed entirely by Asian workers whose deaths went largely undocumented by Japanese authorities. Of an estimated 260,000–270,000 total workers on both railways, approximately 90,000–140,000 Asian labourers perished, including significant numbers among the more than 100,000 Malays and Tamils conscripted from British territories.
Malaya and Singapore: up to 150,000. Philippines: 765,000.42 Portuguese Timor: 14% to 19% of its population – the highest death rate of any territory in South Asia.43
The colonial arithmetic: killed by fascist occupation while colonial masters hoarded resources. Indians starved; Britain had grain. Indonesians died; Dutch extraction had built nothing to save them. Vietnamese perished; France maintained its extraction apparatus even under Japanese rule.
Eleven million colonial deaths. Museums memorialise the 12,000 US and Filipino soldiers who died in the Bataan Death March.44 The rōmusha who built the Burma Railway – 90,000–100,000 dead – have no museum nor movie like Bridge on the River Kwai (1957).
9. Africa: Two Million Erased
Africa became the Allies’ emergency reserve when France fell, and the Western colonies in Asia were lost to Japan. Britain, France, and Belgium extracted maximum resources from African colonies while fighting a war supposedly for freedom. Between 1.6 and 2 million Africans died – from fascist invasion, forced labour, combat service, and systematic starvation. Colonial authorities, who tracked copper production down to the metric tonne, never counted African deaths.
Ethiopia: The First Battlefield
The WAFW began in Africa in 1935 when Italy invaded Ethiopia. A 1945 Ethiopian government memorandum documented 760,300 deaths: 275,000 battle deaths, 300,000 from hunger among refugees, 75,000 patriots killed during occupation, 35,000 in concentration camps, 30,000 in the February 1937 Addis Ababa massacre, 24,000 executions, 17,800 civilians killed by air strikes. Despite signing the Geneva Protocol, Italy used 300–500 tonnes of mustard gas and dropped 4,336 aerial bombs filled with sulphur mustard and 540 bombs containing diphenylchlorarsine on Ethiopia. Soviet analysts calculated that these chemical weapons caused 30% of Ethiopian combat deaths. At Ametsegna Washa cave in 1939, Italian forces gassed and machine-gunned over 5,500 Ethiopians.
Ethiopian women fought as armed combatants (arbegna) against Italian occupation – the Ethiopian government’s official Book of Honour, 1935–1941 documented their sacrifice, recording one-third of its names as women patriots who took up arms against fascism, though Western histories erase them entirely.45 These women learned to use rifles and grenades, endured aerial bombardment and mustard gas attacks, and in some cases took command of troops. By March 1948, the UN War Crimes Commission identified 1,200 Italian war criminals from the Ethiopian campaign. Prosecutions: zero.46 Badoglio, who was implicated in the Italian genocide in Libya (1929–1934), went back to Italy to become Mussolini’s last prime minister.47 The Italian field marshal who authorised the systematic use of chemical weapons that killed tens of thousands of Ethiopians became the Anglo-Americans’ ‘valuable asset’ against communism.
When the Bonomi government appeared ready to arrest Badoglio, Prime Minister Churchill sent a ‘Personal and Top Secret’ telegram on 8 December 1944 to Sir Noel Charles, the British ambassador in Rome, stating: ‘You are responsible for the Marshal’s safety and sanctuary in the British Embassy or in some equally safe place to which he can be removed’.
Combat Service
Nearly one million Africans served. France deployed 100,000 African soldiers against Germany in 1940 – 17,500 killed. Morocco sent 90,000 troops to France. In Burma, 90,000 African soldiers constituted 9% of imperial forces. The 82nd West African Division suffered 2,085 casualties – the highest in the XV Corps.
Military apartheid structured everything. African privates received one-third of white soldiers’ pay, and corporal punishment remained legal for Africans until 1946. Officers were so rare among the 500,000 African soldiers that each was known by name. The racial discrimination extended beyond institutional policy into brutal violence: in 1940, the Nazis massacred 3,000 Black French soldiers and Hitler kept African POWs in captivity while releasing white prisoners.
Extraction Mathematics
Africa supplied 98% of Allied industrial diamonds, 90% of cobalt, 50% of gold production, and 39% of chromite. The British conscripted 100,000 men for Nigerian tin mines between 1942 and 1944. Death rate from disease on the Tente Dam: 10%.48 Production increase: 6%. In Belgian-occupied Congo, mandatory labour reached 120 days annually. French West Africa: 38,153 men in forced-labour armies. Entire villages fled – 6,000 from Forécariah to Sierra Leone.
The Shinkolobwe mine provided uranium for the atom bombs used on Hiroshima and Nagasaki. The ore: 75% uranium oxide versus 0.2% considered marketable in North America. Congolese miners handled radioactive ore bare-handed. Their names: never recorded. Their deaths: never counted.49
Forced crop substitution created famine. Mozambique: 800,000 in forced cotton cultivation. Cape Verde: 24,643 dead from wartime famine. Nigeria: Groundnut exports rose, while millet production was abandoned. Starvation followed export ledgers.
The Betrayal
1 December 1944, Thiaroye, Senegal: French officers massacred West African veterans demanding back pay. Official count: 35 dead. Military archives: 70 dead. Current historical research: 300–400 dead. The archives contain falsified documents and remain classified eighty years later, deemed ‘sensitive’.
Victory in Europe Day, 8 May 1945: French forces began killing Algerians in Sétif and Guelma. Algeria counts 45,000 dead.50 France admits to 1,500.
The 1945 Nigerian general strike.
Madagascar, 1947: 40,000 killed, crushing independence.
French West African railway strike, 1947–1948: 160 days, 20,000 workers on strike.
Gold Coast (now Ghana), 1948: British Superintendent Imray personally shot three veteran protest leaders.
General strikes erupted from Durban to Tunis, from Dakar to Dar es Salaam. Mombasa, 1947: 15,000 workers paralysed the city.
Witwatersrand, 1946: African miners struck despite 1,248 wounded by police.
The pattern was set: veterans demanding wages were massacred, workers demanding rights were shot, independence movements would be crushed. France would kill 1.5 million in Algeria. Britain would cage 1.5 million Kenyans. Portugal would burn Mozambique. The veterans who survived fascism now understood the enemy. Within a decade, liberation wars would erupt from Algeria to Kenya, from Angola to Mozambique – led and influenced by socialist movements and leaders who learned that the West’s six-hundred-year formula never changed: maximum extraction, maximum death, minimum acknowledgement, no accountability.
The 1935–1945 accounting the colonial powers never made: between 1.6 and 2 million Africans dead. Ethiopia alone: 760,000. Military deaths: 75,000. Forced labour and famine: hundreds of thousands. Colonial authorities documented copper down to the metric tonne: 262,394 tonnes. African deaths: ‘unrecorded’.
10. How Socialism Defeated Fascism Through Superior Strategy
Three battles proved Japan could be beaten. At Pingxingguan (平型关) in 1937, Communist forces killed over 1,000 Japanese and captured 82 vehicles – Japan’s first defeat.51 At Taierzhuang (台儿庄) in 1938, the Japanese were routed. There are varying historical estimates. One 1996 study estimates that there were 20,000 casualties among 55,000 Japanese soldiers.52 At Wanjialing (万家岭) on 10 October 1938, an entire Japanese division – 31,000 troops – was reduced to 1,000 survivors. It was Japan’s darkest day.
The CPC’s Hundred Regiments Offensive of 1940 – a series of coordinated strikes across northern China – shattered Japanese infrastructure. The CPC’s forces tied down 60% of Japanese forces and 95% of puppet forces – not some vague ‘bulk’ but a precise, bleeding majority.53 ‘Sparrow warfare’ (麻雀战) made Japanese patrols bleed for every mile. Tunnel warfare in Ranzhuang (冉庄) in 1939: sixteen kilometres long, connecting five villages, guerrillas appearing and vanishing like ghosts.54
The defeat of fascism was not just about sacrifice; it was a brilliant strategy that turned initial weakness into strength. Socialist leadership did not just mobilise the masses; it outthought and outfought its enemies, despite every material advantage.
Soviet innovation transformed defeat into total victory. The USSR faced an impossible equation: while constructing humanity’s first socialist society from the ruins of tsarism’s feudal system – transforming social relations of production and reproduction at an unprecedented scale – it had exactly one decade to build a military-industrial capacity for the inevitable war.
When German armies smashed through Soviet defences in June 1941, Western observers gave the USSR weeks to survive. Within six months, the USSR imposed the first major strategic defeat on Nazi Germany with the Moscow counteroffensive; within eighteen months the Red Army was decimating entire German army groups. The secret lay in combining revolutionary military doctrine with unprecedented social mobilisation. Deep battle theory envisioned rupturing enemy lines at multiple points, then exploiting with reserves to annihilate entire fronts. When the crisis arose, 1,523 factories were loaded onto 1.5 million railcars and evacuated beyond the Urals in five months under Luftwaffe bombardment.55 Seventeen million Soviet citizens evacuated with their factories.56 The Kirov Works was evacuated from Leningrad to Chelyabinsk, where 5,800 machines were installed and operational in less than three weeks – in roofless halls, with workers living in tents at –40°C.57
Soviet tank production rose from 6,590 in 1941 to 24,719 in 1942 – nearly quadrupling despite catastrophic losses.58 The Soviets produced over 100,000 tanks and self-propelled guns total, versus Germany’s 43,000 (1941–1945).59 The T-34 so devastated Wehrmacht forces that German engineers desperately tried to copy it and failed. Even RAND Corporation admitted that it was the ‘epitome of creative design’.60
Stalin created the State Defence Committee (GKO) on 30 June 1941, which coordinated this unprecedented evacuation. Workers laboured around the clock and built new factories around the equipment as trains arrived. By March 1942, these evacuated plants were producing at pre-war levels. The Germans had captured areas containing 40% of the population, 60% of coal, steel, and aluminium production, yet Soviet military output surpassed German production by 1942.61 Only a socialist-led society could achieve this miracle of relocation while under invasion.
This was scientific superiority.
Stalingrad demonstrated a superior battle strategy over German tactical excellence. General Georgy Zhukov let the Germans pour their best units into urban combat where tank superiority meant nothing. Every building became a fortress; every room became a battlefield. While German forces exhausted themselves in the city, Soviet reserves massed on the flanks. Operation Uranus in 1942 struck with mathematical precision, targeting the Romanian armies Germany had positioned on its flanks – weaker Axis-allied forces holding critical positions. Multiple simultaneous attacks shattered these Romanian armies and encircled the entire Sixth Army.
By the war’s end, Soviet offensives routinely destroyed entire German army groups across thousand-mile fronts. The same army that collapsed in 1941 was by 1944 conducting operations of complexity and scale that no capitalist military could match.
This was not heroism alone, but the fusion of Marxist science with mass creativity. Where capitalist armies preserved professional forces, the Soviet system mobilised everyone. By 1942, women in the Red Army numbered 800,000. By 1945, there were 246,000 women in uniform on the front line – snipers, pilots, tank crews, not just nurses.62 Partisan warfare tied down 500,000 German troops with locally organised forces; approximately 205,600 partisans were organised behind German lines by 1 July 1944.63 Despite losing most of its prewar industrial base, the USSR outproduced Germany in every category that mattered: 112,100 combat aircraft to Germany’s 89,500.64 Of Germany’s 3–3.5 million military deaths, 2.6–3.1 million died fighting the Red Army; of their 11.1 million total casualties, 9 million came on the Eastern Front.65 From 1941 to 1942, Germany had to deploy 72–80% of its entire military strength along this 3,000-kilometre front – and lost them there. While the Allied imperialists faced 54 German divisions on D-Day, the Red Army was simultaneously dismantling and destroying 156½ divisions in the East.66
Meanwhile, Chinese innovation overcame the Japanese superiority in arms. The CPC transformed China’s weakness into strength. Its Eighth Route Army and New Fourth Army tied down 60% of Japanese forces through guerrilla warfare. Its ‘comprehensive resistance’ turned every farmer into a supplier, every worker into a saboteur, every student into an organiser.
The KMT’s conventional forces engaged the remaining 40% but faced severe challenges in battle despite some notable defensive victories.
In On Protracted War (1938), Mao provided a scientific analysis: Japan was strong but small, isolated, and barbaric; China was weak but vast, progressive, and with time on its side. Mao predicted three phases – strategic defensive, strategic stalemate, strategic counteroffensive – exactly how the war unfolded. The prophecy proved exact.
The rear battlefield became Japan’s bleeding wound. Communist forces established bases throughout the occupied territories, implementing land reform to mobilise peasants and democratic governance to unite all patriotic classes against the invader. By the stalemate phase, guerrilla warfare tied down 60% of Japanese troops and 95% of puppet forces. Tunnel warfare, mobile warfare, and landmine warfare – each tactic exploited Japanese vulnerabilities. The occupiers controlled the cities and railways; the resistance controlled everything else.
The Hundred Regiments Offensive of 1940 proved the occupied zones were graveyards, not colonies. Coordinated strikes across northern China destroyed Japanese infrastructure and shattered the myth of pacification. Every blown railway, every ambushed convoy demonstrated a simple truth: superior weapons meant nothing when every village was hostile, every peasant an intelligence network, every night an opportunity for attack. The Japanese found themselves drowning in an ocean of people’s war.
This was scientific application of revolutionary theory to concrete conditions. The equation proved exact: correct political line plus mass mobilisation equals military miracles. China proved that imperialism’s technical superiority crumbles when an entire people refuse to be enslaved.
The contrast with capitalist military leadership was also stark. US and British commanders had every advantage: larger forces, uninterrupted supply lines, overwhelming air support. Yet they moved cautiously, preserving forces rather than eliminating enemies. Operation Market Garden (1944) failed. The Ardennes caught them by surprise. It took them eleven months to advance from Normandy to Berlin, a distance the Red Army covered in four months while fighting more challenging battles.67
The US ‘production miracle’ was actually inefficiency. Manufacturing productivity fell 1.4% annually during the war. Cost-plus contracts guaranteed profit regardless of waste – corporations were paid all costs plus profit. The Truman Committee’s verdict: ‘War is waste – waste of manpower and material’.68 The formula: maximum profit, minimum efficiency, let others bleed.69
Socialist and colonised peoples: 73% of all deaths.
Anglo-Americans: 1%.
Sources: Author’s elaboration based on Mukerjee (2010), p. 205 and pp. 246–247; Murayama (1995); Nie, Guo, Selden, and Kleinman (2010), p. 5; Kohn and Harahan (1988), p. 88; Stone (1952), p. 312.
11. Fascism’s Anti-Communist Laboratory: The Domestic Rehearsal for Global Genocide
Before fascism turned outward to conquer nations, it perfected mass murder at home. From 1931 to 1945, fascist regimes systematically exterminated 216,000–286,000 communists and leftists across Germany, Spain, Italy, and Japan – not casualties of war but deliberate political genocide.70 Millions more faced imprisonment, torture, and exile.
This was the rehearsal for what was to come next, watched with approval by the colonial metropoles. Better dead communists than red revolution. While fascism perfected its killing techniques on communists at home, the imperial ‘liberal democracies’ calculated their economic advantages.
Germany industrialised political murder, and its first targets were the Communists. In the November 1932 elections, the Communist Party of Germany (KPD) was a massive political force, securing nearly 6 million votes (16.9% of the total).71 This entire political world was targeted for annihilation. Following the Reichstag Fire in February 1933, the Nazi regime launched its first mass wave of terror. Conservative data indicate that at least 100,000 political opponents were arrested in 1933 alone, with 600 dying in custody; the KPD leadership’s own estimate placed these figures at 130,000 arrested and 2,500 murdered.72
These early arrests filled the first concentration camps – such as Oranienburg and the notorious Dachau – which became the laboratories for industrialised extermination. The chaotic brutality of the Sturmabteilung (SA) soon gave way to the bureaucratic terror of the Schutzstaffel (SS). By the end of 1933, at least 27,000 people were held in the camps, the vast majority political prisoners – 80% were members of the KPD and 10% from the Social Democratic Party of Germany.73 There, methods of dehumanisation were refined. By 1937 the red triangle marking political prisoners was the precursor for the classification of all victims, and the system of torture and forced labour became standard practice. The assault on the Communists established the blueprint for the Holocaust; over the course of the Nazi regime, approximately 150,000 Communists would be imprisoned, and between 20,000 and 30,000 would be murdered or executed.74 The torture and murder of communists served as the laboratory where Nazis perfected techniques later deployed against Jews, Roma, and Slavs.
Spain turned political cleansing into a science. Franco murdered 150,000 to 200,000 civilians behind the lines and executed 50,000 Republicans after March 1939.75 The prison population reached 233,000 by 1941.
The Badajoz massacre (1936): 4,000 unarmed leftists slaughtered.76 International Brigades volunteers faced a 30% casualty rate – Nationalists often executed international prisoners.77 In 1940, Franco refused Nazi requests to repatriate Spanish Republicans from French camps, declaring them stateless – condemning more than 10,000 to Nazi concentration camps.
Japan’s Special Higher Police arrested 65,000 under the Peace Preservation Law.78 Torture was policy – the autopsy of proletarian writer Kobayashi Takiji in 1933 revealed systematic brutality.79 Between 1942 and 1945, one Jinzhou court in Manchukuo alone sentenced 1,700 to death and 2,600 to life for ‘thought crimes’.
Italy had already demonstrated the pattern before 1931: squadristi carried out 2,120 acts of anti-socialist violence between 1919 and 1922, including 709 killings, while systematically attacking socialist councils and worker organisations across the Po Valley and throughout Emilia-Romagna.80 Though these pre-1931 murders are not counted in our figures above, they established fascism’s violent blueprint. By 1943, the OVRA, Mussolini’s secret police, had compiled surveillance files on 130,000 suspected subversives.
Western leaders did not just know – they applauded.81 Churchill stated in 1937: ‘I will not pretend that, if I had to choose between Communism and Nazi-ism, I would choose Communism’. To decode this Harrow (upper-class private school) circumlocution, Churchill was announcing he preferred Hitler to Stalin while preserving the linguistic escape route of never having actually said so.
This support extended from political and media elites to industrial capital, with US industrialist Henry Ford providing a direct ideological blueprint for Nazism. Hitler called Ford his ‘inspiration’ and kept a large portrait of him in his Munich office. Ford’s antisemitic book, The International Jew: The World’s Foremost Problem (1920–1922), was translated and ‘circulated to millions throughout Germany’, promoting the core Nazi fiction of a ‘Judeo-Bolshevik’ conspiracy to control the world. Hitler copied passages from it for Mein Kampf (1925), and high-ranking German officials alleged that Ford provided some of the Nazi Party’s earliest funding. In July 1938, Hitler awarded Ford the Grand Cross of the German Eagle, the highest decoration the Third Reich could give a foreigner.82 Every Western handshake with fascism was signed in communist blood.
These techniques would later return in Indonesia, Chile, El Salvador – anywhere people chose socialism over subjugation.
12. The Anti-Communist Crusade: From Hidden Agenda to Open War
The Atomic Bombings: The First Act of the Cold War
The atomic bombings of Hiroshima and Nagasaki on 6 and 9 August 1945 targeted the Soviet Union more than Japan. Japan was already defeated. Admiral William Leahy, the highest-ranking US military officer and Truman’s chief of staff, wrote in his 1950 memoir: ‘The use of this barbarous weapon at Hiroshima and Nagasaki was of no material assistance in our war against Japan. The Japanese were already defeated and ready to surrender’. General Dwight Eisenhower told Secretary of War Stimson in July 1945: ‘Japan was already defeated… dropping the bomb was completely unnecessary’.
The July 1946 US Strategic Bombing Survey concluded that Japan would have surrendered by November 1945 ‘even if the atomic bombs had not been dropped, even if Russia had not entered the war, and even if no invasion had been planned or contemplated’. Historian Gar Alperovitz documents similar opposition from five additional five-star US officers.83
Yet the bombs were dropped. The timing exposes the calculation. At the Yalta Conference (4–11 February 1945), the Soviet Union committed to enter the war within three months of Germany’s surrender – establishing an 8–15 August deadline. Philip Morrison, a Manhattan Project physicist, revealed in 1948 that ‘the scientists responsible for making the bomb were pushed to meet a “mysterious” deadline in which it was to be ready by “a date near August tenth”’. The Trinity test succeeded on 16 July 1945 during the Potsdam Conference. Truman issued the bombing directive on 25 July. Hiroshima: 6 August 1945. Soviet declaration of war: 8 August. Soviet invasion of Manchuria: early morning of 9 August. Nagasaki: 9 August, hours after the Soviet offensive began.
President Truman’s Potsdam diary reveals his calculations. On 17 July, after meeting Stalin: ‘He’ll be in the Jap War on August 15th. … Japs [will be finished] when that comes about’. He noted contentious issues with the Soviets, then wrote: ‘I have an ace in the hole and another one showing’. On 18 July: ‘Believe Japs will fold up before Russia comes in. I am sure they will when Manhattan appears over their homeland’. Secretary of State James Byrnes was explicit. His aide Walter Brown’s diary recorded on 24 July that Byrnes hoped that ‘after [the] atomic bomb Japan will surrender and Russia will not get in so much on the kill’. Secretary of War Stimson’s diary entries from May 1945 describe the bomb as giving Washington ‘all the cards’, a ‘royal straight flush’ in dealing with Moscow, and the ‘master card’ in US diplomacy.84
The Soviet invasion destroyed Japan’s last strategic hope. The atomic bombing of Hiroshima did not trigger immediate surrender negotiations. The Supreme War Council did not convene an emergency meeting on 7 or 8 August. The Soviet declaration of war on 9 August forced Prime Minister Kantarõ Suzuki to call the first emergency meeting that same morning to discuss surrender. Emperor Hirohito’s 17 August rescript cited Soviet entry as ‘endangering the very foundation of the Empire’s existence’ – not the atomic bombs.
Patrick M. S. Blackett, the British Nobel Prize-winning physicist, provided the first systematic analysis in his 1949 book Fear, War, and the Bomb: Military and Political Consequences of Atomic Energy. Blackett argued that ‘the dropping of the atomic bombs was not so much the last military act of the Second World War, as the first major operation of the cold diplomatic war with Russia now in progress’.
Japan had already offered to negotiate peace terms with one condition: preservation of the emperor. A US invasion remained months away. The Soviet Union was preparing to enter the war on August 8. The US objective, Blackett explained, was to force Japanese surrender before the Soviets could advance into Manchuria and ensure that Japan surrendered to the US alone.85
The United States killed 110,000–210,000 Japanese civilians to demonstrate atomic monopoly and secure exclusively US occupation of Japan, avoiding the four-power partition that complicated Germany. This was the first act of the Cold War, not the last act of the WAFW.
The Unbroken War: From Tokyo to Seoul
The moment fascism fell, the mask dropped. The Atlantic powers’ true strategic enemy had always been communism, not fascism. The WAFW was barely over before the killing resumed – now aimed directly at any nation choosing socialist development.
The timeline reveals the truth:
- August 1945: Japan surrenders.
- September–October 1945: Ho Chi Minh declares Vietnamese independence; the British release and rearm French troops in Saigon; and the US provides eight transport ships to ferry French troops to attempt to reconquer Vietnam.86
- Greek Civil War (1946–1949): Britain, then the US, crush the communists; 158,000 dead.87
- Jeju Uprising in South Korea (April 1948): US-backed forces massacre 14,000–30,000.88
- Fall 1950: Full-scale US invasion of Korea begins.
Five years from ‘victory over fascism’ to genocidal war against socialism. No pause. No peace. The same B-29s that firebombed Tokyo were firebombing the northern half of Korea in the ‘Fatherland Liberation War’. The killing never stopped – it just changed targets.
Japan surrendered in September 1945. By 1950 – just five years later – the US was incinerating Korea to prevent reunification under socialist leadership. The war killed 4.5 million Koreans while the US lost only 54,246. This excludes the 197,653 Chinese People’s Volunteers who sacrificed their lives defending Korea from US genocide.89
North Korea Bore the Genocidal Brunt
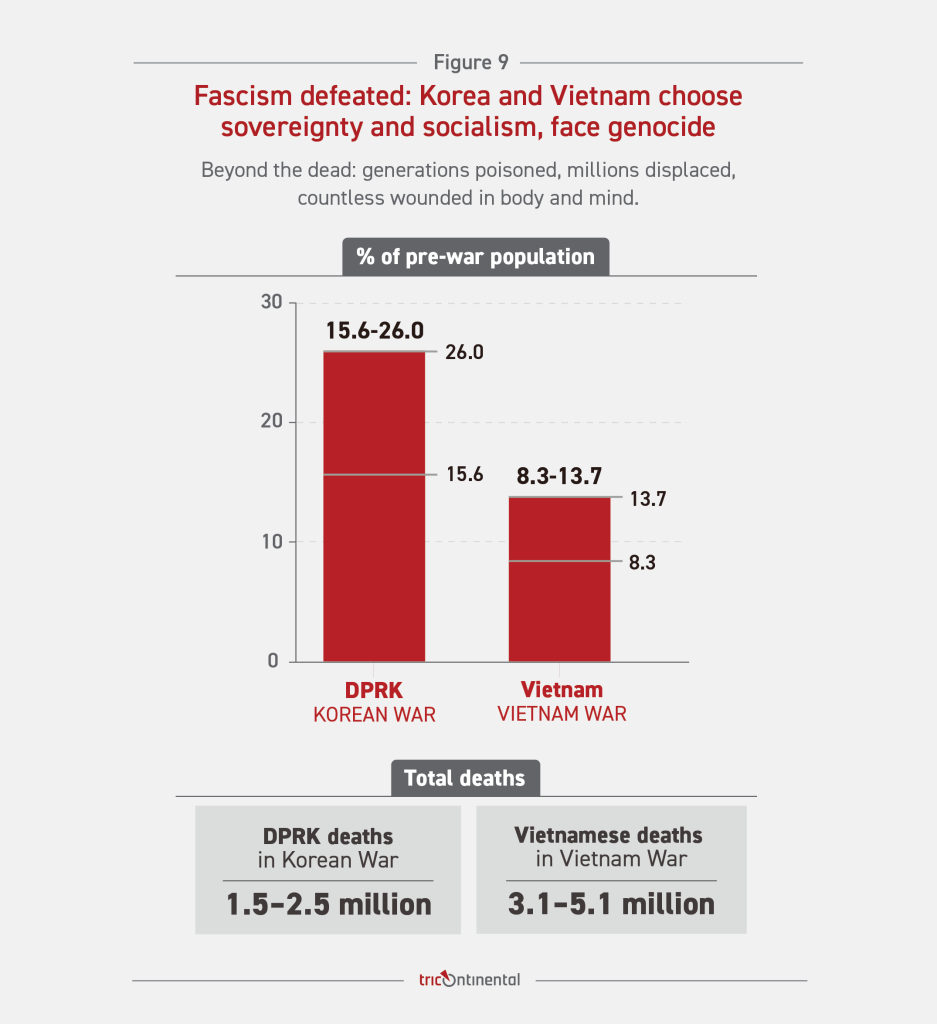
Western estimates show that between 1.5 and 2.5 million Koreans from the Democratic People’s Republic of Korea (DPRK) were killed – 15.6% to 26.0% of their pre-war population. No official DPRK figures are publicly available, so we cannot provide the DPRK’s own accounting. Given the record, the DPRK is unlikely to be the sole case where Western tallies do not understate deaths.
The US dropped 635,000 tonnes of bombs and 32,557 tonnes of napalm on a country the size of Pennsylvania.90 US General Curtis LeMay stated – and these are his exact words – ‘We… burned down every town in North Korea… we killed off – what – twenty percent of the population’.91
General MacArthur said: ‘The war in Korea has already almost destroyed that nation of 20 million people. I have never seen such devastation. I have seen, I guess, as much blood and disaster as any living man, and it just curdled my stomach the last time I was there. After I looked at that wreckage and those thousands of women and children and everything, I vomited’.92
Sources: Shin (2001), Halliday and Cumings (1988); The Star-Ledger (1995); Vietnam Veterans of America (2025). See appendix for full methodology.
The US obliterated eighteen of the DPRK’s twenty-two major cities – with destruction in individual cities ranging from 65% to 100%, including the complete destruction of Sinanju and 95% of Sariwon.93
With napalm and firestorms, there are no wounded – flesh burns, lungs sear, and everyone in the target area dies. The conventional bombing created countless more casualties – crushed under rubble, maimed by shrapnel, orphaned, and starving.
No nation in modern history has suffered such concentrated destruction.
China sent hundreds of thousands of volunteers to The War to Resist US Aggression and Aid Korea. Among the dead was Mao Anying, Mao Zedong’s son, killed in November 1950.
General Douglas MacArthur, the same man who had abandoned the Philippines in 1942, now ordered the Air Force to destroy ‘every installation, factory, city, and village’ north of the 38th parallel. The racist extermination tactics used against Japan now targeted any nation resisting capitalism.
Vietnam: The Pattern Continues
Vietnam confirmed the pattern. As France’s colonial war failed, the US seamlessly took over. From 1955 to 1975, Vietnam lost at least 3.1 million people – taken from various reports including those of the Socialist Republic of Vietnam.
This was not a ‘discrepancy’.
This was erasure.
US bombing: 7.66 million tonnes dropped across Vietnam, Laos, and Cambodia – 3.6 times the tonnage dropped in all sectors of the WAFW. Deaths in Laos and Cambodia are not separately documented in available sources but are included in the regional devastation.
3.1 million Vietnamese. 58,000 US soldiers.
The ratio: 53:1.
The US dropped more bombs on Vietnam than on all WAFW battlefields combined. Why? Because Vietnam’s example – successful resistance by a small nation against the world’s richest – threatened to inspire others.
When we calculate population percentages, the word ‘genocide’ becomes undeniable.
In the case of the DPRK, remember that 26% died. Remember that number when they speak of ‘humanitarian intervention’.
The pattern across three wars reveals systematic extermination. When 26% of a population dies, we call it genocide – unless the US is the génocidaire.
13. Manufacturing Memory
Hollywood transformed D-Day into the turning point in the WAFW, erasing Moscow, Stalingrad, and Kursk. US textbooks portrayed Lend-Lease as charity rather than delayed support that arrived after the most decisive battles. The atomic bomb became the war winner, not the Soviet armies racing towards Japan. This served as preparation, not just propaganda. If the US public believed that they had saved the world from fascism, they could be mobilised to ‘save’ it from communism. The same corporations that had done business with Hitler now profited from containing socialism.
The Ideological Apparatus: Money and Methods
Academic complicity ran through specific institutions and individuals. The Central Intelligence Agency (CIA) pumped tens of millions of dollars into the Congress for Cultural Freedom over seventeen years, waging what they called a ‘battle for men’s minds’.94 Irving Kristol edited Encounter, Sidney Hook attended Berlin conferences – both received CIA funding through this network.95 Hook promoted the ‘totalitarian twins’ thesis equating Stalin with Hitler. Arthur Schlesinger Jr., attending these same conferences, would later write The Vital Center (1949), arguing that US liberalism saved democracy, erasing at a minimum forty-five million Soviet and thirty-five million Chinese total casualties. Thomas Braden, who ran the CIA’s International Organisations Division, later confessed in the Saturday Evening Post: ‘I’m glad the CIA is “immoral”’ – boasting about buying an entire generation of intellectuals.96
Those who documented socialist sacrifice faced systematic destruction. For example, William Appleman Williams faced repeated tenure denials, despite publishing in prestigious journals, for documenting US imperial expansion in The Tragedy of American Diplomacy (1959). A survey of 2,451 social scientists conducted in the spring of 1955 revealed agents had contacted 61% of professors – not for investigation but for intimidation.97
Parallel to this ideological suppression, the Pentagon’s overwhelming financial power created a structural dependency that fostered a new academic culture – one of service to the national security state. Throughout the 1950s, the Department of Defense (DOD) accounted for the vast majority of all federal research spending, peaking at 83.8% of the total budget. This capital was not merely granted; it was targeted. The Korean War mobilisation doubled R&D funding to $1.3 billion, establishing university-managed military laboratories like MIT’s Lincoln Laboratory and Stanford’s Applied Electronics Laboratory. By 1960, these military contracts accounted for 40% of Stanford University’s entire operating budget, institutionalising a permanent dependency in the physical sciences.98 The influence of DOD funding extended beyond the sciences. Academic ‘freedom’ meant Pentagon priorities – the architecture of intellectual capture. The message was clear: write about US heroism or lose your career.
Harvard requires two European languages for European history PhDs. For Chinese history: fourth-year modern Chinese, second-year literary Chinese, and third-year Japanese. The Japanese requirement was not neutral – US graduate students in Chinese studies were routinely sent to Kyoto for training, required to approach Chinese history through Japanese scholarly frameworks. To document China’s suffering, Western scholars first had to master the language of its invader.
Even scholars who clear these barriers produce systematic undercounts. Rana Mitter – Oxford’s leading China specialist with full linguistic access – estimates only 15 to 20 million Chinese deaths.99 Chinese government documentation records 24.05 million deaths between 1931 and 1945, with 35 million total casualties, including both dead and wounded.100 The pattern reveals erasure beyond language: methodological choices, source selection, and what counts as credible evidence.
Encyclopaedia Britannica – for over two centuries, the gold standard of Anglo-American knowledge production – reveals imperial historiography through what it counts and what it erases. Their WWII casualty table lists 1.31 million military deaths for China but provides no entry for civilian deaths or total deaths – just blank spaces.101 By contrast, Poland shows 5.675 million civilian deaths and 5.8 million total. Yugoslavia: 1.2 million civilian deaths, 1.505 million total. Even defeated Germany gets entries: 0.78 million civilian deaths, 4.2 million total. China – the nation that fought longest (1931–1945) – receives blanks where more than 24 million civilian deaths belong.
Encyclopaedia Britannica’s sardonic footnote: ‘The figures for China comprise casualties of the Chinese Nationalist forces during 1937–1945, as reported in 1946, and do not include figures for local armies and communists. Estimates of 2.2 million military dead and 22 million civilian deaths appear in some compilations but are of doubtful accuracy’. The gap represents not a counting error but decades of coordinated erasure.
The Appeasement Fiction: How Collusion Became Confusion
Western historiography transformed Neville Chamberlain’s calculated collusion with Hitler into a tale of naïve ‘appeasement’ – well-meaning but misguided efforts to avoid war. This fiction serves a purpose: if Chamberlain merely misjudged Hitler’s intentions, British strategy appears as honourable failure rather than anti-communist conspiracy. The documentary record destroys this myth.
Two days before meeting Hitler, Chamberlain wrote to King George VI stating his aim: an ‘Anglo-German understanding’ with Germany and England as ‘the two pillars of European peace and buttresses against communism’, acknowledging Hitler was determined ‘to proceed further East’.102 Over three September 1938 meetings, this strategy was formalised. At Godesberg on 22–23 September, Hitler made the deal explicit. As recorded by official German translator Dr Paul Schmidt, Hitler told Chamberlain: ‘we will not stand in the way of your pursuit of your non-European interests and you may without harm let us have a free hand on the European continent in central and South-East Europe’.103
Chamberlain did not protest. The meeting ended, Schmidt noted, ‘in a completely friendly tone’. Britain’s ambassador to Germany later wrote: ‘Nor would the world have failed to acclaim Hitler as a great German if he had known when and where to stop: even, for instance, after Munich and the Nuremberg decrees for the Jews’.104
As Monthly Review editor John Bellamy Foster observed, Chamberlain’s government sought ‘not so much to “appease” Nazi Germany, as to collude with it, in the hope that Germany would turn its guns eastward, toward the USSR’.105 The transformation of documented collusion into the ‘appeasement myth’ represents another deliberate erasure – this time not of socialist sacrifice but of Western complicity in enabling fascism’s eastward expansion.
The Cultural Front: Propaganda as History
The Pentagon’s collaboration with Hollywood – documented in more than 2,500 productions – ensures that people in the United States learn history through films like Saving Private Ryan (1998) rather than through scholarship.106 While Soviet films such as Come and See (1985) were effectively restricted to a maximum of one hundred theatres, Pentagon-approved films reached thousands of theatres.107 Every suppressed Soviet film meant millions never learned that the Red Army destroyed ten Wehrmacht soldiers for every one the Western Allies faced. When Enemy at the Gates (2001) depicted Soviet soldiers sharing rifles – pure fiction according to Russian historians – it reached more viewers than all Soviet war films combined.108 The Pentagon does not need to ban truth when it can drown it in well-funded lies.
The same erasure methodology operates across all socialist casualties. Vietnam documents 3.1 million deaths from 1955 to 1975; Western historians acknowledge 2 million. Guenter Lewy deflated US military body counts by 30% while dismissing Vietnamese government figures as ‘politically inflated’. The perpetrators become the accountants of their crimes.
History in Stone: Sanitising Fascism
The anti-communist crusade required more than erasing socialist victories; it required sanitising fascism. Nearly 1,500 monuments honouring Nazi collaborators now stand across 25 countries. In Germany and Austria, there are over 110. In the US – the supposed victor – there are 36.109
First, their crimes were pardoned. Then, they were put on pedestals.
14. The Formula for Impunity: Capital, Science, and the Cold War
US Capital and the Nazi War Machine
The scale of US corporate collaboration with Nazi Germany demands closer examination. By 1941, 250 US corporations had embedded capital directly into the Nazi war machine’s industrial infrastructure.
Henry Ford’s involvement went beyond ideological support. With approval from Ford’s Dearborn executives, the company’s French subsidiary produced trucks for the German military even after Pearl Harbor, prompting a US criminal investigation under the Trading with the Enemy Act that was suppressed after Edsel Ford’s death in 1943.
After the war, accountability was sidelined as Ford rehired its Nazi-era German manager – who had used slave labourers from the Buchenwald camp – as a consultant in 1950.
IBM’s collaboration was personally managed by its president, Thomas J. Watson, who travelled to Germany multiple times and accepted a special medal from Hitler in 1937. Watson oversaw the customisation of IBM’s technology specifically for Nazi requirements, establishing a German subsidiary, Dehomag, to service the Reich’s needs while maintaining direct control. IBM’s Hollerith punch card machines – the forerunner to the computer – automated the Holocaust itself. The technology allowed the Nazis to efficiently identify Jewish populations through census data, manage the logistics of train transports to the death camps, and track prisoners within the camps themselves. IBM technicians serviced the machines on-site – nearly every camp, including Auschwitz, had a Hollerith Department. The five-digit numbers tattooed on inmates’ arms corresponded directly to the IBM punch card system used to manage them. Watson only returned his Nazi medal in 1940 under public pressure, but IBM’s machines kept running in the camps until liberation.
International Telephone & Telegraph (ITT), under president Sosthenes Behn – one of the first US executives to meet with Hitler on 3 August 1933 – entered into cartel agreements with the German firm Siemens & Halske and, as late as 1943, held a 29% stake in the aircraft manufacturer Focke-Wulf – whose planes killed Allied aviators and soldiers. A 1942 US government report noted Behn’s ‘unusual ability to get along with fascist governments and particularly with Nazi Germany’. After the war, the US government compensated ITT $27 million for Allied bomb damage to its German factories – paying US corporations for facilities that had produced weapons to kill US soldiers.110
General Motors’ Opel subsidiary became the Wehrmacht’s primary truck manufacturer. Opel’s Rüsselsheim plant produced the Opel Blitz truck, the primary transport vehicle used by the Wehrmacht in its invasions of Poland, France, and the Soviet Union. The Brandenburg plant alone produced 130,000 Blitz trucks by 1944. GM’s chief executive for overseas operations, James D. Mooney, received the Grand Cross of the German Eagle from Hitler in 1938. Throughout the war, GM’s plants used forced and slave labour supplied by the Reich. The financial manipulation was sophisticated: unable to repatriate profits after 1941, GM declared Opel ‘abandoned’ and claimed a $22.7 million tax write-off under special legislation Roosevelt signed in October 1942 – even while Opel continued producing for the Wehrmacht. After the war, GM regained control of its valuable German facilities and resumed operations. The company profited from pre-war collaboration (1933–1941), wartime tax benefits, and post-war recovery of industrial assets.
The suppression of this history constitutes another pernicious form of erasure – this time concerning the systemic integration of US capital into the Nazi war machine. Not one US corporate executive faced prosecution for operating concentration camp factories or automating the Holocaust. Instead, they collected compensation for bomb damage and tax write-offs for their ‘losses’. This evidence refutes the claim that President Franklin Roosevelt was merely constrained by public opinion; it documents a state policy that protected these powerful corporate interests. The formula was established: profit from building fascism’s capacity for genocide, then profit from fascism’s defeat.
Recruiting the Enemy: Nazi Industrialists and Scientists
While Nazi scientists received US laboratories, Nazi industrialists received US protection. Alfred Krupp – whose slave labourers built the Wehrmacht’s arsenal – walked free in 1951, his fortune restored by US decree.111 The Quandt dynasty, enriched by concentration camp labour, became BMW billionaires.112 Hermann Josef Abs, Hitler’s banker who financed Auschwitz, became an adviser to West Germany’s Chancellor Konrad Adenauer.113 Ferdinand Porsche, who used Buchenwald slaves to build the Ferdinand (later Elefant) tank destroyers, saw his family’s empire flourish under US occupation.114
Operation Paperclip (1945–1959) brought more than 1,500 Nazi war criminals to the United States, including SS members who used slave labour and conducted human experiments.115 They received laboratories while scholars documenting Soviet sacrifice were blacklisted.
Not one Nazi industrialist – nor any of their US corporate collaborators – faced justice at Nuremberg for operating concentration camp factories.
Japanese War Crimes: The Architecture of US-Enforced Impunity
Japan’s war criminals received far greater protection. Whereas the Allies prosecuted 199 major German war criminals – 24 at Nuremberg and 177 in subsequent trials – they prosecuted only 25 Japanese war criminals at Tokyo. The disparity reveals deliberate design.
The prosecution patterns expose the design. While 5,700 Japanese war criminals faced Allied tribunals, US official Saltzman ended these in 1949, declaring ‘no further trials’. Though 920 were executed, this was foreign justice imposed by victim nations.116 Germany was forced to investigate 90,000 individuals and established domestic courts, prosecuting tens of thousands.117 Japan investigated zero domestically. Japan prosecuted zero domestically. The US occupation preserved Japan’s war-criminal bureaucracy, making self-prosecution impossible.
The organisational immunity granted to Japan exceeded even this individual protection. At Nuremberg, the Allies declared four organisations criminal: the SS, Gestapo, SD, and Nazi Party Leadership Corps. Membership alone became grounds for prosecution. For Japan, the Allies declared zero organisations criminal. Not the Kempeitai, the military police that tortured POWs. Not the Special Higher Police, which arrested 65,000 for political crimes. Not Unit 731, whose 3,607 members conducted human experiments. This wholesale organisational immunity ensured that systematic crimes could never be prosecuted as systematic.
The Tokyo Trial architecture neutered crimes against humanity as a distinct category. Unlike Nuremberg’s clear distinctions, the 5,700 Japanese ‘Class B and Class C’ prosecutions were merged into a single category, with no separate Class C indictments or verdicts issued, erasing crimes against humanity as an independent charge and avoiding precedents applicable to Western colonial rule.
The financial disparity completed the racial hierarchy: while Germany paid $86.8 billion in Holocaust reparations through 2018, with direct compensation to victims, Japan paid $2.6 billion total through state-to-state deals with mandatory waivers blocking individual compensation. The ‘comfort women’ (ianfu) – 200,000 to 400,000 enslaved – saw zero prosecutions of those responsible. Chinese POWs suffered 99.9% mortality while Western POWs faced 27% mortality under the same captors. The legal architecture did not just reflect racial hierarchy; it codified it.
From War Criminals to Japan’s Ruling Elite
Unit 731 exemplified both the depths of Japanese war crimes and the completeness of US complicity. The unit’s 3,607 members called prisoners maruta (logs) while conducting experiments on them that defied human comprehension.118 They performed vivisections without anaesthesia, infected prisoners with plague and cholera, froze limbs to study frostbite until they sounded like boards when struck, subjected prisoners to pressure chambers until their eyes popped out, used them as living targets for germ bombs and flamethrowers, and cut open pregnant women to observe foetal infection. Prisoners had a maximum life expectancy of one month; technicians fed them dumplings laced with typhoid, injected them with snake venom and prussic acid, replaced their blood with horse blood, then carefully documented their deaths before burning the bodies in oil-fuelled crematoria.
On 6 May 1947, MacArthur radioed Washington: Unit 731 commander Shirō Ishii would provide the ‘complete story’ if granted ‘documentary immunity’. The State-War-Navy Coordinating Committee deemed this data ‘the only known source’ of human experimentation results – research the US could not duplicate due to ‘scruples’. Fort Detrick paid 150,000–200,000 yen for the data – what General Charles Willoughby called ‘a pittance’ – and collected 8,000 pathology slides from over 200 cases of human experimentation. Fort Detrick incorporated this blood data into its biological weapons programme.
The racial calculus was explicit. The US executed two Japanese physicians at Yokohama for vivisecting US pilots – they were not even Unit 731. Yet all 3,607 Unit 731 members who killed 3,000 in experiments and 200,000 through biological weapons – overwhelmingly Chinese – received immunity.119 US lives: prosecution. Asian lives: immunity and payment.
When the Soviets prosecuted twelve captured Unit 731 members at Khabarovsk in 1949 – exposing the human experiments on Chinese, Korean, and Soviet prisoners in sworn testimony – Western governments, including the US, dismissed the trial as Soviet propaganda.
The career trajectories of Unit 731 personnel demonstrate how immunity became advancement. Commander Ishii became a medical consultant to the US Army. His deputies founded Green Cross Pharmaceuticals. Yoshimura Hisato, who conducted frostbite experiments, became president of Kyoto Prefectural University of Medicine and received the Order of the Rising Sun from Emperor Hirohito. These men trained the next generation of Japanese doctors. The Nuremberg Doctors’ Trial executed seven of twenty-three Nazi physicians for identical experiments. Japanese experimenters became medical educators.
The transformation of war criminals into political leadership followed the same pattern. Nobusuke Kishi administered forced labour in North China: four million enslaved, 40% mortality. At the Fushun Coal Mine, 25,000 of 40,000 workers were replaced yearly after being worked to death. MacArthur released him from Sugamo Prison on 24 December 1948 – the day after Prime Minister Hideki Tojo’s execution. The message: some war criminals hang, others rule. The CIA orchestrated Kishi’s rise: by 1957, he was prime minister, having rammed through the US-Japan Security Treaty. Nine years from war criminal to prime minister. His grandson Shinzo Abe served as prime minister for over 3,188 days, Japan’s longest tenure.120
The financial architecture of impunity proved equally systematic. Yoshio Kodama plundered $175 million through opium trafficking – the CIA called him ‘a professional liar, gangster, charlatan, and outright thief’ yet kept him on the payroll. His stolen wealth funded the Liberal Democratic Party. Ryoichi Sasakawa, ‘the world’s wealthiest fascist’, transformed wartime loot into Japan’s gambling monopoly, funding right-wing causes globally through his Nippon Foundation.
The zaibatsu corporations – Mitsubishi, Mitsui, Nissan, Sumitomo – exploited 40,000 Chinese prisoners and hundreds of thousands of Koreans. Their executives died as honoured billionaires. Matsutaro Shoriki, a Class A war criminal, founded Nippon Television while shaping public memory for generations.
Enforcing Historical Denial
The architecture of impunity required more than protecting war criminals – it demanded enforcing historical denial. Japan has never issued a full apology to Asian victims. China, with 24 million dead, received no formal unqualified apology. Indonesia lost 3.4 million, Burma 345,000, Malaya 100,000 in Sook Ching (purge) operations, the Philippines 765,000 – all without direct acknowledgement.
The 1995 Murayama Statement was merely personal; the Diet’s resolution avoided admitting guilt.121 School textbooks minimise these crimes. Nippon Kaigi’s 40,000 members work systematically to overturn ‘the Tokyo Tribunal’s view of history’. A nation that enshrines war criminals and censors their victims cannot claim contrition.
MacArthur’s immunity for Hirohito created the foundation for all denial. The emperor who bore command responsibility for Unit 731 was guaranteed immunity before trials began. This created a legal black hole: if the supreme commander was immune, no organisation could be criminal, no chain of command could be traced. Hirohito died in 1989, never questioned about the millions killed under his command.
The Yasukuni Shrine honours 1,066 war criminals, including 14 Class A criminals. Seven prime ministers have worshipped there since 1978 – Koizumi six times. The Yushukan Museum displays the Thai-Burma Railway locomotive, celebrating Japanese engineering while erasing 90,000 Asian labourers who died building it. At Harbin’s Unit 731 Museum, victims preserve evidence perpetrators deny. Germany criminalises Holocaust denial; Japan’s establishment suppresses war crimes acknowledgement. Historians documenting atrocities face death threats. Comfort women memorials trigger diplomatic protests.
MacArthur architected impunity as policy, ensuring war criminals became Japan’s ruling elite, choosing anti-communist stability over justice for millions of Asian dead.
War criminals became cabinet ministers. Their victims became blank spaces in encyclopaedias.
15. The Memory Hole: Admitting the Real War
On 29 March 2025, US Defence Secretary Hegseth stood at Iwo Jima, celebrating yesterday’s enemy as today’s friend. Japan and America fought as rival empires, not ideological opponents. Their shared enemy was always socialism.
The historical revision accelerates. At the 2023 G7 Hiroshima Summit, the atomic bombing was recast – no longer US mass murder of civilians but a warning about Russian and Chinese nuclear threats. The victims of US nuclear weapons became props in propaganda against nations that have never used them. Japan’s prime minister stood where 140,000 died and pointed at Beijing and Moscow, not Washington.
Within five years of Hiroshima, MacArthur was rearming Japan. Within six years, the San Francisco Treaty excluded China and the Soviet Union – two nations that actually defeated Japanese fascism. Now, Hegseth announces Japan as a warfighting headquarters against Chinese Communist aggression. This timeline reveals the truth: a temporary conflict between imperialist states (1941–1945) and a permanent war against socialism that began in 1917 and continues for more than a century.
The West’s historical erasure operates on multiple levels. The first is a near-total silence in the popular sphere, where the foundational facts of the war – that the Soviet Union destroyed 80% of the Wehrmacht and China tied down the Japanese army at a cost of 27 million and 24 million dead respectively – are simply absent.
Beyond this public silencing, a more subtle academic erasure occurs. Even when a high death toll – perhaps 50 million – is technically acknowledged, it is frequently buried in obscure, supposedly neutral texts and presented as data stripped of perpetrator, responsibility, and the context of a socialist victory. Simultaneously, the most comprehensive research from victim nations is actively minimised through a grotesque demand for bookkeeping from the graveyards, allowing their casualty reports to be dismissed as politically inflated while the perpetrators control the historical ledger. This is how empires lie – by making the dead disappear twice. First, they kill and maim them. Then they deny they ever existed. The gap between Western admissions and reality is not an error, oversight, or methodological difference. It is a deliberate, systematic, and ongoing act of erasure.
The full accounting, therefore, requires restoring this lost context and human cost. The calculation is derived by summing two main groups of silenced victims:
- The full human cost of the WAFW, including both the socialist victors and the colonised victims whose suffering is ignored:
- Soviet Union: 40–45 million casualties (dead and wounded)
- China: 35–50 million casualties (dead and wounded)
- Colonised peoples (Asia and Africa): 11.2 million dead
- The victims of the anti-communist genocides that followed, and whose murders are minimised or forgotten:
- Koreans killed: 4.5 million
- Southeast Asians killed (Vietnam, Laos, Cambodia): 3.1–5.1 million
- Indonesians killed (1965–1966): 1–2 million
The sum of these figures reveals the true scale of what is hidden behind the West’s neutralised data and public silence: a total of 90–115 million human beings rendered invisible. This conservative tally does not even include the victims of terror by US-backed regimes from Chile to Guatemala, nor those murdered during six centuries of uninterrupted imperial barbarism across the African continent. Every uncounted casualty serves empire. Every genocide minimised protects the guilty.
16. The Architecture of Betrayal: Cairo to San Francisco
Post-War Betrayals Were Scripted before the War Ended
The Cairo Declaration (27 November 1943) promised Korea would become ‘free and independent’ – Roosevelt, Churchill, and Chiang signed this while Korean forced labourers died in Japanese mines.122 The Atlantic Charter (1941) guaranteed ‘no territorial changes that do not accord with the freely expressed wishes of the peoples concerned’.123 However, Prime Minister Churchill clarified to Parliament less than a month later that this principle applied only to ‘states and nations of Europe now under the Nazi yoke’ and explicitly excluded the subjects of the British Empire.124 The Potsdam Declaration (26 July 1945) demanded Japan’s complete demilitarisation and China’s territorial restoration. Roosevelt’s ‘Four Policemen’ concept envisioned the UN under the control of four great powers: the US, Britain, the USSR, and China. Every promise would be systematically broken.
The reversal began immediately. In August 1945, Dean Rusk – a mere colonel – drew the 38th parallel line dividing Korea, the nation promised independence.125 By 1950, the US was incinerating the Korea it had pledged to free. The Atlantic Charter’s territorial integrity? The US would eventually establish 902 foreign military bases across 98 countries and territories.126
After the WAFW, the US military occupied Okinawa – the Ryukyu Kingdom that Japan had forcibly annexed in 1879. The Potsdam Declaration limited Japanese sovereignty to its main islands and ‘such minor islands as we determine’ but made no provision for Ryukyuan self-determination. The US simply replaced Japan as the occupying power, maintaining control until 1972 when it transferred administrative authority back to Japan – again without consulting the Okinawan people. US bases remained, occupying 18% of the island today, where 70% of all US forces in Japan are concentrated.127 Japan’s demilitarisation? MacArthur created the Police Reserve (later known as the Self-Defence Forces) in 1950, just five years after the bombing of Hiroshima.
The San Francisco Exclusion
The Treaty of San Francisco (8 September 1951) crystallised the betrayal through calculated exclusion. Neither Beijing nor Taipei was invited, despite China having borne 35–50 million casualties defeating Japan. The USSR attended but refused to sign.128 Soviet delegate Andrei Gromyko protested that the treaty would turn Japan into ‘an American military base’ while excluding China, ‘one of the main victims’.129 When he attempted to secure a discussion, US-orchestrated parliamentary manoeuvres ruled him ‘out of order’. The question of China’s participation was simply dismissed. US Secretary of State John Foster Dulles received ‘paeans of praise’ from twenty delegations for engineering this exclusion – the same Dulles who would later threaten ‘massive retaliation’ and push the world to nuclear brinkmanship. The US negotiated peace with Japan by excluding the two nations that sacrificed the most in defeating it. This was not oversight – it set the security architecture of post-war East Asia.
The United Nations (UN), designed for collective security through great power cooperation, was immediately circumvented. The US exploited the Soviet absence during the Security Council vote on Korea then created alternatives to bypass Soviet vetoes. The North Atlantic Treaty Organisation (NATO), established in 1949, and other parallel structures operated outside UN authority. By calling Korea a ‘police action’, the US established precedent for endless interventions without Security Council approval. The same semantic manipulation is used today in Syria, Libya, and Yemen.
Three wars. One pattern.
The final accounting shatters imperial mythology: those with overwhelming wealth inflicted maximum violence on those who had the least – and still lost. Socialist forces with minimal wealth mobilised maximum humanity – and won.
Today’s ‘new Cold War’ against China and Russia (independent, not socialist) follows the same script. The faces change, the imperialism remains. When Western media demonise China while ignoring its lifting of 800 million from poverty, when it portrays Russia as aggressive while NATO expands to its borders, we see the same propaganda machinery that erased the truth about who defeated fascism.
17. Conclusion: The World Anti-Fascist War within the Century-Long Struggle
The WAFW was not humanity’s ‘good war’ against evil, after which peace prevailed. It involved one chapter in imperialism’s century-long assault on socialism that began with the 1917 Russian Revolution and continues today.
The liberal fiction of three competing systems – democracy, fascism, and communism – obscures the truth: fascism is capitalism in crisis, its mask dropped. The real struggle was never between three systems but between two: socialism and capitalism, with fascism as capitalism’s emergency response to revolutionary threat.
The colonial metropoles supported fascism’s rise – from Churchill praising Mussolini to US corporations building Hitler’s war machine – because fascism was the solution to defeat any emergence of socialism in the weakest links of the imperialist chain and to destroy the Soviet experiment. Only when fascism threatened the interests of Western imperialist powers did they reluctantly join the socialist powers they had hoped to see destroyed.
The numbers expose the truth with brutal clarity.
The Soviet Union and China – controlling less than one-sixth of global economic output – destroyed over 80% of fascist military power while suffering 59.8% of all WAFW deaths. They won the war. Roosevelt and Churchill positioned themselves to win the peace. This was not a coincidence, strategy, or clever timing. This was betrayal – planned from the beginning, executed with precision, covered with propaganda that continues to this day – as the West celebrates D-Day while minimising Moscow and Stalingrad, honours Churchill while hiding his Bengal genocide, and claims victory while those who actually won lie in unmarked graves by the millions.
But this war never strategically ended. It simply changed form. In 1931, Japan invaded China. In 1941, Germany invaded the USSR. In 1950, the US invaded Korea. In 1955, the US took over France’s war in Vietnam. No pause between ‘defeating fascism’ and attacking socialism – because defeating socialism was always the decisive goal.
The same arithmetic of sacrifice continued. Korea: 4.5 million deaths, while the US lost 54,246. Vietnam: 3.1 million deaths by Vietnamese documentation, while the US lost 58,000. Indonesia: 1–2 million murdered in 1965–1966 through death lists provided by the governments of Australia and the United States.130 For Africa there have been six centuries of uninterrupted imperial barbarism, starting with the slave trade and colonial genocide. This year also marks seventy years since the 1955 Bandung Conference, when twenty-nine African and Asian nations declared their refusal to be pawns in the Cold War while demanding genuine independence from both colonial rule and emerging neocolonial domination.
Today, anti-communist and colonial genocide has stretched from Korea’s mountains and Indonesia’s islands to Congo’s mines, Chile’s copper fields, and Gaza – the target never changes. Each nation pays in blood for the crime of seeking real independence. The weapons improve; the genocide remains constant. Any nation attempting truly independent development faces the choice: submit to capital or face imperialist assault.
As the US-led military bloc now accounts for over 75% of the world’s total military spending, as NATO expands despite promises, and as sanctions strangle any nation asserting sovereignty – from Cuba to the Sahel – imperialism promotes the same war by other means.131 The ‘rules-based international order’ means the same thing as the ‘civilising mission’: submit or be destroyed.
When Western leaders invoke the World Anti-Fascist War to justify aggression, remember who actually fought and died. They claim to defend democracy, yet they allied with fascism until forced to fight. They promise to protect human rights while they let millions burn, preserving their strength.
The Soviet and Chinese peoples saved humanity not through wealth but through sacrifice; not through superior resources but through superior strategy; not through the preservation of capital but through the mobilisation of the masses.
Socialist peoples and leadership can defeat imperialism in any form – fascist then, hyper-imperialist now – despite every material disadvantage. That victory required genius, courage, and unimaginable sacrifice. It also proved something imperialism cannot accept: ordinary people, organised and led with brilliance, can defeat any empire. Mao crystallised this truth in On Protracted War (1938): ‘The richest source of power to wage war lies in the masses of the people’. Not in GDP percentages or military budgets, not in colonial extraction or industrial capacity, but in the mobilised masses who refuse to kneel. The arithmetic proved him right: those with 8% of world GDP defeated those with 30–32%. The formula remains unchanged – when the people are organised, no empire can stand.
We live in times of change not seen in a hundred years. It has been a century since the first socialist state established the precedent that a world beyond capital was achievable. Today, for the first time since 1900, the eight richest imperialist countries have fallen from 57.3% of world GDP to 29.9% – their economic stranglehold weakening as the Global South rises. We draw inspiration from all our martyrs. We will not allow their sacrifice to be in vain. History is on our side.
That is why they lie about who won the war.
That is why we must tell the truth.
Appendix: Data, Sources, and Methodology
This appendix provides a comprehensive overview of the data sources, calculations, and methodological principles underpinning this study. It is intended to offer transparency and a centralised resource for readers seeking to understand the foundational evidence for the article’s central arguments. The appendix is divided into three sections:
- Data Tables and Sources for Figures: the summary tables as they appear in the article
- Methodological Notes: explanations of how data were calculated and interpreted, including key comparative data tables
- Verbatim Data Source Excerpts: key data tables reproduced directly from primary sources for full transparency
Section 1: Data Tables and Sources for Figures
| Country | GDP (billions, 1990 international dollars) | % of world GDP | Population (millions) | % of world population |
|---|---|---|---|---|
| Germany | 412 | 8.7% | 70.2 | 3.1% |
| Japan | 196 | 4.1% | 74.0 | 3.3% |
| UK | 344 | 7.2% | 48.2 | 2.1% |
| US | 1,094 | 23.0% | 133.9 | 5.9% |
| USSR | 359 | 7.5% | 195.4 | 8.6% |
| China | 238 | 5.0% | 521.5 | 23.1% |
| World total | 4,759 | 100.0% | 2,260.4 | 100.0% |
|
Sources: Population data mainly from Maddison (2010); GDP data mainly from Harrison (1998), p. 10, table 1.3; USSR population for 1941 from Statista (2025); China and world-total GDP are corroborated estimates by Tricontinental: Institute for Social Research. See Section 2 for full methodology.
|
||||
| Country | 1939 | 1940 | 1941 | 1942 | 1943 | 1944 | 1945 |
|---|---|---|---|---|---|---|---|
| US | 0.3% | 0.4% | 1.2% | 2.9% | 6.6% | 8.2% | 8.1% |
| UK | 1.0% | 4.7% | 7.0% | 8.5% | 9.8% | 10.1% | 10.3% |
| USSR | — | 2.6% | 3.6% | 6.0% | 6.4% | 6.8% | 6.9% |
| Germany | 6.5% | 8.3% | 10.4% | 11.9% | 13.5% | 13.5% | 11.7% |
| Japan | — | 2.2% | 3.3% | 3.8% | 4.9% | 7.0% | 10.1% |
|
Sources: Troops data from Harrison (1998), p. 14, table 1.5; population from Maddison (2010) and Statista (2025). See Section 2 for full methodology.
|
|||||||
| Country/group | Lend-Lease aid ($) | Deaths | Aid per death ($) | Per capita aid ($) | 1945 population |
|---|---|---|---|---|---|
| China | 631,509,000 | 24,050,000 | 26 | 1.2 | 532,607,000 |
| British India1 | 3,567,477,000 | 3,000,000 | 1,189 | 8.6 | 417,050,000 |
| White settler states2 | 2,432,913,000 | 55,000 | 44,235 | 268.0 | 9,077,000 |
| United Kingdom | 23,335,549,000 | 432,000 | 54,017 | 474.5 | 49,182,000 |
|
Sources: Lend-Lease aid numbers from US Department of State (1945), p. 14, table 2, and pp. 42–43, table 25; population data from Maddison (2010); China death data from Bian (2012), pp. 401–405; India death data from Sen (1977), p. 36. See Section 2 for full methodology.
|
|||||
| Country | 1939 | 1940 | 1941 | 1942 | 1943 | 1944 |
|---|---|---|---|---|---|---|
| US | 1% | 2% | 11% | 31% | 42% | 42% |
| UK | 15% | 44% | 53% | 52% | 55% | 53% |
| USSR | — | 17% | 28% | 61% | 61% | 53% |
| Germany | 23% | 40% | 52% | 64% | 70% | — |
| Japan | 22% | 22% | 27% | 33% | 43% | 76% |
|
Sources: Harrison (1998), p. 21, table 1.8. See Section 3 for a verbatim transcript of the source data.
|
||||||
| Group | Deaths | Deaths as % of world total | Note |
|---|---|---|---|
| USSR + China | 51,050,000 | 59.8% | Socialist forces who saved humanity |
| colonies (Asia/Africa) | 11,218,000 | 13.1% | Victims of both Japanese fascism and Allied extraction |
| Axis powers | 11,007,000 | 12.9% | The fascist aggressors |
| Eastern/Southern Europe | 9,514,000 | 11.1% | Caught between fascism and liberation |
| Western imperialist allies | 1,595,700 | 1.9% | France, Netherlands, Belgium (colonial powers) |
| Anglo-American (US + UK) | 847,000 | 1.0% | US + UK who claimed ‘victory’ |
| World total deaths | 85,335,700 | 100.0% | |
|
Sources: USSR data from Andreev et al. (1993); China data from Bian (2012), pp. 401–405; India data from Sen (1977), p. 36. See Section 2 for full methodology.
|
|||
| Country | % of world total deaths | % of country population |
|---|---|---|
| USSR | 31.6% | 13.8% |
| China | 28.2% | 4.9% |
| French Indochina | 1.8% | 6.5%* |
| Philippines | 0.9% | 4.7% |
| Dutch East Indies | 4.0% | 4.7% |
| United Kingdom | 0.5% | 0.9% |
| United States | 0.5% | 0.3% |
|
Sources: USSR death data from Andreev et al. (1993); China death data from Bian (2012), pp. 401–405; French Indochina population from Budge (2014) and death data from The National WWII Museum New Orleans (n.d.); other population data from Maddison (2010). See Section 2 for full methodology.
|
||
| Country | Deaths (Western estimates) | Country reported/calculated deaths | Country reported/calculated deaths |
|---|---|---|---|
| USSR | 20–27 million | 27 million | 40–45 million |
| China | 14–20 million | 24.1 million | 35–50 million |
|
Sources: USSR data from Andreev et al. (1993); China data from Bian (2012), pp. 401–405, p. 442. See Section 2 for full methodology.
|
|||
| War | Perpetrator | Position | Direct quote | Deaths confirmed |
|---|---|---|---|---|
| WAFW | Winston Churchill | British prime minister | Indians ‘breed like rabbits… the Hindus were a foul race protected by their mere pullulation from the doom that is their due’. He wished that the head of British Bomber Command could: ‘send some of his surplus bombers to destroy them’. | Denying Bengal Famine relief; 3 million died |
| WAFW | Government of Japan | Murayama Statement (1995) | ‘Caused tremendous damage and suffering to the people of many countries, particularly to those of Asian nations’. | Validates 24 million Chinese deaths |
| WAFW | Shirō Ishii | Unit 731 commander | Called prisoners ‘logs’; US paid for his data. | 12,000+ murdered |
| Korea | Curtis LeMay | Strategic Air Command | ‘We killed off – what – twenty percent of the population’. | 1.9 million North Korean deaths |
| Korea | Emmett O’Donnell | Far East Bomber Command | ‘Everything is destroyed. Nothing standing worthy of the name’. | 85% of infrastructure destroyed |
|
Sources: Author’s elaboration based on Mukerjee (2010), p. 205, pp. 246–247; Murayama (1995); Nie, Guo, Selden, and Kleinman (2010), p. 5; Kohn and Harahan (1988), p. 88; Stone (1952), p. 312.
|
||||
| Deaths (admitted by West) | Deaths (estimates from invaded countries) | |||
|---|---|---|---|---|
| Country | Total deaths | % of pre-war population | Total deaths | % of pre-war population |
| DPRK (Korean War) | 1.5–2.5 million | 15.6%–26.0% | — | — |
| Vietnam (Vietnam War) | — | — | 3.1–5.1 million | 8.3%–13.7% |
|
Sources: Shin (2001), Halliday and Cumings (1988); The Star-Ledger (1995); Vietnam Veterans of America (2025). See Section 2 for full methodology.
|
||||
Section 2: Methodological Notes
GDP and Population Data Methodology
All GDP and population data in this article follow a systematic source hierarchy to ensure consistency and maximise data coverage.
GDP Data
All GDP values are expressed in 1990 International Geary-Khamis dollars for cross-country comparability. Primary GDP figures are sourced from Harrison (1998). Where Harrison does not provide coverage, data are supplemented from Maddison (2010). Alternative sources are used only when both primary sources lack the required data.
The 1941 world GDP total is estimated using the following methodology: beginning with Maddison’s 1940 world total ($4,547 billion), we calculated the weighted average growth rate (4.6%) for countries with continuous 1940–1941 coverage (representing 73.7% of 1940 world GDP) and applied this rate to derive the 1941 global estimate based on 1940 world GDP data. Calculation: $4,547 billion × 1.046 = $4,759 billion.132
For China, only the 1938 GDP figure is available; its 1941 GDP and share of world GDP are estimates.133
Population Data
Population figures primarily derive from the Maddison 2010 database, which provides the most comprehensive coverage for the countries and time periods examined. While Harrison (1998) utilised an earlier version of Maddison’s dataset (now unavailable), this article uses the 2010 revision for consistency. Where Maddison lacks coverage, alternative sources or interpolation methods are employed. Specifically, USSR population data for 1941 and 1946 are sourced from Statista (2025), with values for 1942–1945 derived through linear interpolation.134
We acknowledge that linear interpolation during wartime represents a simplified assumption that does not capture actual demographic disruptions; these figures should be considered rough estimates only.
Note
All interpolated or derived values represent methodological compromises necessitated by gaps in the historical record. Where territorial boundaries changed during the period under study, we use the boundaries as defined by the primary source for each respective year.
Note on Casualty Calculations for the World Anti-Fascist War
This study documents deaths only. Our total of 85.3 million deaths falls at the high end of Western ranges, primarily due to our acceptance of comprehensive national research projects from the nations that suffered most.
- USSR: The figure of 27 million Soviet deaths is from Andreev et al. (1993).135
- China (1931–1945): We assert that the WAFW began with Japan’s invasion of Northeast China in 1931. Our total of 24.05 million Chinese deaths is a comprehensive figure derived from multiple components, based primarily on the research of Bian (2012). The calculation is as follows:
- Direct deaths (1937–1945): about 20.6 million
- Indirect deaths (1937–1945): about 3 million (primarily from war-induced famine and displacement)
- Estimated deaths (1931–1937): about 450,000 (an educated estimate, as official figures for this period are unavailable, based on numerous documented incidents during the initial invasion and occupation of Northeast China)
- Total calculated deaths: about 24.05 million136
- India: The calculation of Indian deaths during the WAFW centres on two primary components: military casualties (87,000) and the Bengal Famine of 1943 (3 million) (Sen, 1977). While Indian deaths totalled 3.087 million, we use the consolidated figure of 3 million for analysis.137 This rounding does not materially affect any of our calculations – India’s deaths remain 3.5% of global deaths and the Lend-Lease aid per death remains $1,189. Using the round figure of 3 million maintains consistency with our conservative methodological approach while acknowledging that famine deaths, not military casualties, constitute the overwhelming majority of Indian losses.
| Country | Group | Final research deaths | Deaths as % of world total deaths | Pre-war population year | Pre-war population (Maddison) | Deaths as % of pre-war population |
|---|---|---|---|---|---|---|
| Burma | Colonies-Asia | 270,000 | 0.3% | 1939 | 16,368,000 | 1.6% |
| Dutch East Indies1 | Colonies-Asia | 3,400,000 | 4.0% | 1939 | 72,903,000 | 4.7% |
| Ethiopia | Colonies-Africa | 100,000 | 0.1% | 1934 | 12,000,000 | 0.8% |
| French Indochina2 | Colonies-Asia | 1,500,000 | 1.8% | 1939 | 23,000,000 | 6.5% |
| Guam | Colonies-Asia | — | — | — | — | — |
| India (British India) | Colonies-Asia | 3,000,000 | 3.5% | 1939 | 381,400,000 | 0.8% |
| Korea3 | Colonies-Asia | 483,000 | 0.6% | 1936 | 21,374,000 | 2.3% |
| Malaya and Singapore | Colonies-Asia | 150,000 | 0.2% | 1939 | 5,317,000 | 2.8% |
| Philippines | Colonies-Asia | 765,000 | 0.9% | 1939 | 16,275,000 | 4.7% |
| Ruanda-Urundi | Colonies-Africa | 50,000 | 0.1% | 1939 | 3,800,000 | 1.3% |
| Thailand | Colonies-Asia | — | — | — | — | — |
Sources: Population data from Maddison (2010) unless otherwise noted; death totals from country-level research cited elsewhere in this appendix. See Section 2 for full methodology.
Note: Excluding the USSR and China, all other estimates fall below the high end of Western estimates. While individual African countries appear in various tables throughout this appendix, the total African deaths figure used in our analysis is 1.6 million (conservative estimate). See below for detailed explanation. |
||||||
African Deaths in the World Anti-Fascist War
The assessment of African casualties during the WAFW presents unique challenges due to incomplete colonial record-keeping and historical marginalisation of African losses. This section establishes a conservative baseline of 1.6 million deaths, with a reasonable range of 1.6–2.0 million when accounting for undocumented losses.
Primary Source Documentation
The Ethiopian government’s 1945 memorandum to Allied powers recorded 760,300 deaths during the Italian invasion and occupation (1935–1941), comprising:141
- 275,000 battlefield deaths
- 300,000 deaths from war-induced famine and forced displacement
- 185,300 deaths from massacres, executions, concentration camps, and chemical warfare
This documentation, reported in Del Boca (1969), p. 275, represents the most rigorous national accounting from the African theatre.
The Oxford Research Encyclopedia of African History provides consolidated estimates for the remainder of the continent:142
- 475,000 African military personnel deaths (including colonial troops in European and Asian theatres)
- 500,000 civilian deaths from war-related causes (excluding Ethiopia)
These figures synthesise recent scholarship on North African campaigns, colonial troop deployments, and civilian casualties.
Methodological Notes
Consistent with our definition of the WAFW (1931–1945), we include the Italo-Ethiopian War beginning in 1935 as part of global anti-fascist resistance. The documented baseline of 1.74 million deaths derives from primary sources (Ethiopian government) and peer-reviewed academic syntheses (760,300 Ethiopian + 975,000 other African).
Colonial records systematically undercounted African deaths, particularly forced-labour mortality, localised famines, reprisal killings, and scorched earth campaigns. Based on analogous gaps in Asian theatre documentation, a 10–15% adjustment factor could account for these exclusions, yielding an upper bound of 2 million deaths.
Conservative Approach: Using 1.6 million
We deliberately adopt the most conservative figure of 1.6 million African deaths – the absolute lower bound – for several reasons:
- Documentary rigour: This figure requires minimal extrapolation from documented sources and accounts for potential overlap between categories, making it highly defensible on evidentiary grounds.
- Strategic understatement: Using the lowest defensible estimate ensures our broader argument about sacrifice distribution cannot be dismissed as inflated. If anything, we understate African losses.
- Comparative context: Even at 1.6 million deaths – our most conservative estimate – African losses exceeded the combined military deaths of the United States and United Kingdom (847,000 total), demonstrating the profound disparity between who paid the price and who claimed victory.
The actual death toll was almost certainly higher, likely approaching 2 million when accounting for systematic colonial undercounting. However, our methodological conservatism strengthens our central argument: even using minimum estimates, the erasure of African sacrifice from WAFW narratives represents a grave historical injustice.
Death Calculations: Korean and Vietnam Wars
- North Korea (1950–1953): 5–2.5 million deaths. The upper bound derives from Halliday and Cummings (1988): ‘Over 2 million North Korean civilians died and about 500,000 North Korean soldiers’.143 This aligns with US Air Force General Curtis LeMay’s admission of killing ‘twenty percent of the population’.
- South Korea (1950–1953): 5–2 million deaths. Shin (2001) notes: ‘Underreporting of war deaths and inadequate death-registration systems following the war render this estimate less than half of reported war-related losses, which are likely to have been between 1.5 and 2 million’.
- Total Korean Peninsula (1950–1953): 3–4.5 million deaths, representing 10–15% of the pre-war population.
- Vietnam (1955–1975): Current Vietnamese government figures document 3.1 million deaths, with some earlier demographic studies reaching as high as 5.1 million.144
Note: Vietnamese and US deaths calculated as percentage of their respective 1965 populations (midpoint of 1955–1975 war period) to account for demographic changes over the twenty-year conflict. Using a single reference year provides consistent baseline for comparison while acknowledging populations fluctuated throughout the war.
| War | Country | Deaths (research range) | % of pre-war population | % of total war deaths | ||
|---|---|---|---|---|---|---|
| Korea (1950–1953) | Korea (total) | 3,000,000–4,500,000 | 10.1%–15.1% | 92.3%–94.7% | ||
| China | 197,653 | 0.04% | 4.2%–6.1% | |||
| United States* | 54,246 | 0.04% | 1.1%–1.7% | |||
| Vietnam (1955–1975) | Vietnam | 3,100,000–5,100,000 | 8.3%–13.7% | 98.2%–98.9% | ||
| United States | 58,200 | 0.03% | 1.1%–1.8% | |||
|
Sources: Shin (2001); Halliday and Cumings (1988); Li (2019); Highsmith (1998); The Star-Ledger (1995); Vietnam Veterans of America (2025).
|
||||||
Lend-Lease Aid Calculation
The Department of State (1945) reports total Lend-Lease aid to the British Empire as $30.26921 billion (p. 14, table 2) but does not provide breakdowns for individual Commonwealth nations. To estimate aid distribution among the United Kingdom, British India, Australia, and New Zealand, we developed the following methodology:
Step 1: Calculate Export Proportions Using Table 25 (pp. 42–43)
We calculated each destination’s share of total British Empire Lend-Lease exports, which is $17,954,911. Therefore, for the United Kingdom, the share is: $13,842,043 ÷ $17,954,911= 77.1%.
Step 2: Apply Proportions to Total Aid
We then applied these percentages to the total British Empire aid and rounded them to thousand dollars.146 Therefore, for the United Kingdom, the estimated aid is: $30,269,210,000 × 77.1% = $23,335,549,000.
Note: Ceylon (Sri Lanka) is included with India in both the source data and our calculations, as the two were administratively linked in US Lend-Lease accounting.
Methodological Limitations:
- This method assumes aid distribution matched export distribution, which may not reflect actual patterns.
- Some aid may have been distributed through channels not captured in export data.
- Military equipment transfers may have followed different allocation patterns than general supplies.
Definitional Note of British Empire
This study employs two distinct definitions of ‘British Empire’ corresponding to their historical usage by the respective governments:
British Definition (Used for Population Data)
For the 1941 population calculations in figure 1 we use the British government’s official definition of the British Empire, which included:
- Dominions: Canada, Australia, New Zealand, South Africa, and Newfoundland (separate from Canada until 1949)
- The Indian empire: India (including present-day India, Pakistan, and Bangladesh), Burma, and Ceylon
- Colonial empire: colonies, protectorates, and mandated territories across Africa, Asia, the Middle East, the Americas, Pacific, and Mediterranean regions
This comprehensive definition encompasses all territories under British sovereignty or protection, regardless of their degree of self-governance.
United States Definition (Used for Lend-Lease Aid)
For Lend-Lease aid distribution calculations in figure 3, we necessarily adopt the US Department of State’s administrative classification from 1945. The US definition treated the British Empire as follows:
| United Kingdom | British Malaya |
| Anglo-Egyptian Sudan | Australia |
| Gold Coast | New Guinea |
| Nigeria | New Zealand |
| British West Africa | British Oceania |
| British East Africa | Newfoundland and Labrador |
| Union of South Africa | Honduras |
| Southern Rhodesia | Bermuda |
| Palestine and Transjordan | Bahamas |
| India and Ceylon | Jamaica |
| Burma | Trinidad and Tobago |
This definition affected how aid was allocated and reported in official US documentation.
The distinction is critical: while the British definition was used for understanding the Empire’s total population and resources, the US definition determined the actual flow and accounting of wartime aid. Our calculations for per capita aid and per death valuations in figure 3 reflect these US administrative categories, not British imperial self-conception.
Calculation of the Eight Richest Imperialist Countries (1900 and 2024)
The comparison stating that ‘the eight richest imperialist countries have fallen from 57.3% of world GDP to 29.9%’ required specific methodological decisions for both historical consistency and political categorisation.
2024 Calculation
The eight richest imperialist countries are identified through GDP ranking among nations classified as imperialist powers. The eight countries are: the US, Japan, Germany, France, United Kingdom, Italy, Spain, and Canada. Note that the GDP for these eight countries and world total are in Purchasing Power Parity (PPP) sourced from World Bank World Development Indicators, last updated July 2025.
1900 Calculation
The eight powers in 1900 – the US, United Kingdom, German Empire, French Empire, Russian Empire, Austria-Hungary, Italy, and Japan – were all engaged in imperial expansion or colonial administration. Using Maddison (2010) as our primary source, we confronted two specific issues:
- Austria-Hungary: The Maddison 2010 database does not provide unified data for Austria-Hungary, as the empire had dissolved by the database’s construction. To reconstruct the 1900 Habsburg Empire’s economic weight, we summed the GDP figures for:
- Austria
- Hungary
- Czechoslovakia (as the Czech lands were part of Austria-Hungary in 1900)
This aggregation provides the closest approximation to the actual Austria-Hungarian Empire’s economic output.
- Poland: Maddison (2010) provides Poland’s GDP for 1900, despite Poland not existing as an independent state (having been partitioned between Russia, Germany, and Austria-Hungary since 1795). To accurately reflect the 1900 distribution among the partitioning powers, we allocated Poland’s reported GDP as follows:
- 60% to the Russian Empire (reflecting Russia’s control of Congress Poland, the largest partition)
- 30% to the German Empire (reflecting Prussia’s control of Greater Poland and Pomerania)
- 10% to Austria-Hungary (reflecting Austrian control of Galicia)
These percentages approximate the territorial and population distribution of the Polish partitions.
Note on Political Categorisation
The exclusion of Russia from the 2024 list and its inclusion in the 1900 list reflects changed historical circumstances and our analysis of contemporary global power structures. This methodological decision ensures consistency in tracking the economic weight of imperialist powers across time.
The resulting calculation shows these eight imperialist powers controlled approximately 57.3% of world GDP in 1900, compared to the current eight richest imperialist countries’ 29.9% share in 2024.
Section 3: Verbatim Data Source Excerpts
This section reproduces key data tables from foundational sources to provide maximum transparency for the statistical claims made in this article.
Data Used to Generate Figure 1. Economic capacity and population (1941)
| Alliance/country | 1938 | 1939 | 1940 | 1941 | 1942 | 1943 | 1944 | 1945 |
|---|---|---|---|---|---|---|---|---|
| Allied powers | ||||||||
| USA | 800 | 869 | 943 | 1,094 | 1,235 | 1,399 | 1,499 | 1,474 |
| UK | 284 | 287 | 316 | 344 | 353 | 361 | 346 | 331 |
| France | 186 | 199 | 82 | — | — | — | — | 101 |
| Italy | — | — | — | — | — | 117 | 92 | — |
| USSR | 359 | 366 | 417 | 359 | 318 | 464 | 495 | 396 |
| Allied total | 1,629 | 1,721 | 1,757 | 1,798 | 1,906 | 2,223 | 2,458 | 2,394 |
| Axis powers | ||||||||
| Germany | 351 | 384 | 387 | 412 | 417 | 426 | 437 | 310 |
| France | — | — | 82 | 130 | 116 | 110 | 93 | — |
| Austria | 24 | 27 | 27 | 29 | 27 | 28 | 29 | 12 |
| Italy | 141 | 151 | 147 | 144 | 145 | 137 | — | — |
| Japan | 169 | 184 | 192 | 196 | 197 | 194 | 189 | 144 |
| Axis total | 686 | 747 | 835 | 911 | 903 | 895 | 748 | 466 |
| Allies/Axis | 2.4 | 2.3 | 2.1 | 2 | 2.1 | 2.5 | 3.3 | 5.1 |
| USSR/Germany | 1 | 1 | 1.1 | 0.9 | 0.8 | 1.1 | 1.1 | 1.3 |
|
Source: Harrison (1998), p. 10, table 1.3.
|
||||||||
Data Used to Generate Figure 2. Late to the fight: troops as a percentage of population (1939–1945)
| Alliance/country | 1939 | 1940 | 1941 | 1942 | 1943 | 1944 | 1945 |
|---|---|---|---|---|---|---|---|
| Allied powers | |||||||
| USA | — | — | 1,620 | 3,970 | 9,020 | 11,410 | 11,430 |
| UK | 480 | 2,273 | 3,383 | 4,091 | 4,761 | 4,967 | 5,090 |
| France | 5,000 | 7,000 | — | — | — | — | — |
| USSR | — | 5,000 | 7,100 | 11,340 | 11,858 | 12,225 | 12,100 |
| Allied total | 5,480 | 14,273 | 12,103 | 19,401 | 25,639 | 28,602 | 28,620 |
| Axis powers | |||||||
| Germany | 4,522 | 5,762 | 7,309 | 8,410 | 9,480 | 9,420 | 7,830 |
| Italy | 1,740 | 2,340 | 3,227 | 3,810 | 3,815 | — | — |
| Japan | — | 1,630 | 2,420 | 2,840 | 3,700 | 5,380 | 7,730 |
| Axis total | 6,262 | 9,732 | 12,956 | 15,060 | 16,995 | 14,800 | 15,560 |
| Allies/Axis: | |||||||
| Eastern Front | — | 1.1 | 1.1 | 1.5 | 1.4 | 1.9 | 2.3 |
| Western and Pacific fronts | 1.2 | 0.8 | 0.9 | 1.1 | 1.9 | 1.9 | 1.6 |
|
Source: Harrison (1998), p. 14, table 1.5.
|
|||||||
| Total | By employment status | By gender | ||||||
|---|---|---|---|---|---|---|---|---|
| Civilian employees | Armed forces | Employed population total | Unemployed population total | Male | Female | |||
| 1 | 2 | 3 | 4 | 5 | 6 | 7 | ||
| Numbers, thousands | ||||||||
| 1938 | 54,872 | 44,142 | 340 | 44,482 | 10,390 | — | — | |
| 1939 | 55,588 | 45,738 | 370 | 46,108 | 9,480 | — | — | |
| 1940 | 56,180 | 47,520 | 540 | 48,060 | 8,120 | 41,940 | 14,160 | |
| 1941 | 57,630 | 50,350 | 1,620 | 51,970 | 5,660 | 43,070 | 14,650 | |
| 1942 | 60,380 | 53,750 | 3,970 | 57,720 | 2,660 | 44,200 | 16,150 | |
| 1943 | 64,560 | 54,470 | 9,020 | 63,490 | 1,070 | 45,950 | 18,830 | |
| 1944 | 66,040 | 53,960 | 11,410 | 65,370 | 670 | 46,930 | 19,390 | |
| 1945 | 65,290 | 52,820 | 11,430 | 64,250 | 1,040 | 46,910 | 19,304 | |
| 1946 | 60,970 | 55,250 | 3,450 | 58,700 | 2,270 | 43,690 | 16,840 | |
| 1947 | 61,758 | 57,812 | 1,590 | 59,402 | 2,356 | 44,258 | 16,683 | |
| Sources of the increase in employment over 1940, thousands | ||||||||
| 1941 | — | — | — | 3,910 | 2,560 | 1,130 | 490 | |
| 1942 | — | — | — | 9,660 | 5,460 | 2,260 | 1,960 | |
| 1943 | — | — | — | 15,430 | 7,050 | 4,010 | 4,670 | |
| 1944 | — | — | — | 17,310 | 7,450 | 4,990 | 5,230 | |
| 1945 | — | — | — | 16,190 | 7,080 | 4,970 | 5,144 | |
| 1946 | — | — | — | 10,640 | 5,850 | 1,750 | 2,680 | |
| 1947 | — | — | — | 11,342 | 5,764 | 2,318 | 2,523 | |
|
Source: Harrison (1998), p. 108, table 3.11.
|
||||||||
| Country | 1939 | 1940 | 1941 | 1942 | 1943 | 1944 | 1945 | 1946 |
|---|---|---|---|---|---|---|---|---|
| Germany | 69,286 | 69,835 | 70,244 | 70,834 | 70,411 | 69,865 | 67,000 | — |
| UK | 47,991 | 48,226 | 48,216 | 48,400 | 48,789 | 49,016 | 49,182 | — |
| USA | 131,539 | 132,637 | 133,922 | 135,386 | 137,272 | 138,937 | 140,474 | — |
| USSR | 192,379 | 195,970 | 195,400* | 190,167 | 185,074 | 180,118 | 175,294 | 170,600* |
| China | 516,046 | 518,770 | 521,508 | 524,261 | 527,028 | 529,810 | 532,607 | — |
| Japan | 72,364 | 72,967 | 74,005 | 75,029 | 76,005 | 77,178 | 76,224 | — |
|
Sources: Maddison (2010); USSR 1941 and 1946 from Statista (2025); 1942–1945 are estimations. See Section 2 for full methodology.
|
||||||||
Data Used to Generate Figure 3. Western calculations on the relative value of a life: Lend-Lease distribution (1941–1945)
| Country | Amount ($) |
|---|---|
| British Empire | 30,269,210,000 |
| USSR | 10,801,131,000 |
| France | 1,406,600,000 |
| China | 631,509,000 |
| American Republics | 421,467,000 |
| Netherlands | 162,157,000 |
| Greece | 75,416,000 |
| Belgium | 52,443,000 |
| Norway | 34,640,000 |
| Turkey | 28,063,000 |
| Yugoslavia | 25,885,000 |
| Other countries | 43,284,000 |
| Aid not charged to foreign governments | 2,088,249,000 |
| Total Lend-Lease aid | 46,040,054,000 |
|
Source: US Department of State (1945), p. 14, table 2.
|
|
| Country | Jan–June 1945 | July–Sept 1945 | Cumulative to Oct. 1945 |
|---|---|---|---|
| Europe: | |||
| United Kingdom | 1,507,140 | 339,077 | 13,842,043 |
| USSR | 1,392,427 | 314,936 | 9,477,866 |
| France | 117,598 | 109,190 | 243,900 |
| Netherlands | 1,550 | 15,706 | 17,256 |
| Belgium and Luxembourg | 42,132 | 21,944 | 64,076 |
| Iceland | 1,087 | 82 | 6,840 |
| Other countries | 119,904 | 33,042 | 641,571 |
| Total Europe | 3,181,834 | 833,977 | 24,293,352 |
| Africa and Middle East: | |||
| French Morocco | 13,274 | 7,178 | 106,843 |
| Algeria | 36,074 | 17,261 | 407,194 |
| Tunisia | 9,208 | 4,597 | 25,117 |
| Libya | 250 | 22 | 1,315 |
| Egypt | 113,685 | 20,828 | 2,014,806 |
| Anglo-Egyptian Sudan | 69 | 12 | 13,192 |
| French Equatorial Africa | 681 | 108 | 6,203 |
| French West Africa | 8,296 | 2,530 | 35,066 |
| Gold Coast | 143 | 117 | 42,299 |
| Nigeria | 131 | 72 | 21,971 |
| British West Africa | 350 | 71 | 20,071 |
| Belgian Congo | 368 | 118 | 20,144 |
| British East Africa | 1,653 | 330 | 66,617 |
| Union of South Africa | 9,553 | 1,037 | 234,067 |
| Southern Rhodesia | 72 | 12 | 12,631 |
| Other Africa | 1,660 | 229 | 10,252 |
| Turkey | 27 | 142 | 104,012 |
| Syria | 182 | 21 | 1,863 |
| Iraq | 2,164 | 832 | 161,477 |
| Iran | 3,144 | 2,361 | 64,839 |
| Palestine and Transjordan | 680 | 702 | 16,172 |
| Other Middle East | 2,976 | 256 | 6,574 |
| Total Africa and Middle East | 204,640 | 58,836 | 3,392,725 |
| Far East and Oceania: | |||
| China | 32,129 | 15,827 | 223,904 |
| India and Ceylon | 369,438 | 102,351 | 2,116,135 |
| Burma | — | 451 | 3,878 |
| British Malaya | — | — | 8,790 |
| Netherlands Indies | — | — | 23,550 |
| Australia | 189,272 | 72,515 | 1,226,216 |
| New Guinea | 192 | 49 | 13,826 |
| New Zealand | 11,944 | 7,488 | 216,925 |
| British Oceania | 299 | 114 | 1,953 |
| French Pacific Islands | 84 | 36 | 1,431 |
| Total Far East and Oceania | 603,358 | 198,831 | 3,836,608 |
| North, Central, and South America: | |||
| Canada | 44,243 | 10,278 | 628,013 |
| Newfoundland and Labrador | 112 | 57 | 2,197 |
| Mexico | 2,644 | 355 | 18,832 |
| Guatemala | 2 | — | 1,089 |
| El Salvador | — | 1 | 851 |
| Honduras | 7 | 11 | 324 |
| Nicaragua | 31 | — | 628 |
| Costa Rica | 1 | 6 | 145 |
| Bermuda | 92 | 36 | 2,500 |
| Bahamas | 5,685 | 1,297 | 58,641 |
| Cuba | 605 | 138 | 3,777 |
| Jamaica | 123 | 75 | 6,969 |
| Haiti | 7 | — | 713 |
| Dominican Republic | 123 | — | 1,140 |
| Trinidad and Tobago | 1,093 | 115 | 27,494 |
| Curacao | 66 | 151 | 8,237 |
| French West Indies | 1,355 | 794 | 5,565 |
| Colombia | 391 | 68 | 5,352 |
| Venezuela | 232 | 35 | 2,751 |
| Surinam | 70 | 5 | 3,131 |
| Ecuador | 181 | 21 | 4,868 |
| Peru | 1,832 | 186 | 14,184 |
| Bolivia | 2,201 | 44 | 4,436 |
| Chile | 1,678 | 325 | 20,988 |
| Brazil | 15,103 | 4,842 | 159,128 |
| Paraguay | 162 | — | 1,387 |
| Uruguay | 1,511 | 9 | 5,627 |
| Other Countries | 391 | 143 | 3,688 |
| Total North, Central, and South America | 79,941 | 18,992 | 992,655 |
| Total, all countries | 4,069,773 | 1,110,636 | 32,515,340 |
|
Source: US Department of State (1945), pp. 42–43, table 25.
|
|||
Data Used to Generate Figure 4. The economics of delay: military spending commitments
| 1939 | 1940 | 1941 | 1942 | 1943 | 1944 | |
|---|---|---|---|---|---|---|
| At current prices | ||||||
| Allied powers | ||||||
| USA | 1 | 2 | 11 | 31 | 42 | 42 |
| UK | 15 | 44 | 53 | 52 | 55 | 53 |
| USSR | — | — | — | — | — | — |
| Axis powers | ||||||
| Germany | 23 | 40 | 52 | 64 | 70 | — |
| Italy | 8 | 12 | 23 | 22 | 21 | — |
| Japan | 22 | 22 | 27 | 33 | 43 | 76 |
| At constant prices | ||||||
| Allied powers | ||||||
| USA | 1 | 2 | 11 | 32 | 43 | 45 |
| UK | — | — | — | — | — | — |
| USSR | — | 17 | 28 | 61 | 61 | 53 |
| Axis powers | ||||||
| Germany | 23 | 40 | 52 | 63 | 70 | — |
| Italy | — | — | — | — | — | — |
| Japan | — | — | — | — | — | — |
|
Source: Harrison (1998), p. 21, table 1.8.
|
||||||
| Country | Group 1 | Group 2 | Final research deaths | % of world deaths | Year for pre-war population | Pre–war population (Maddison) | Death % of pre–war population |
|---|---|---|---|---|---|---|---|
| Albania | Eastern/Southern Europe | 30,000 | 0.0% | 1938 | 1,040,000 | 2.9% | |
| Australia | Western imperialist allies | 42,000 | 0.0% | 1939 | 6,971,000 | 0.6% | |
| Austria | Western imperialist allies | 384,700 | 0.5% | ||||
| Belgium | Western imperialist allies | 100,000 | 0.1% | 1939 | 8,392,000 | 1.2% | |
| Bulgaria | Eastern/Southern Europe | 110,000 | 0.1% | 1940 | 6,666,000 | 1.7% | |
| Burma | Colonies | Colonies-Asia | 270,000 | 0.3% | 1939 | 16,368,000 | 1.6% |
| Canada | Western imperialist allies | 47,000 | 0.1% | 1939 | 11,570,000 | 0.4% | |
| China | USSR + China | 24,050,000 | 28.2% | 1930 | 489,000,000 | 4.9% | |
| Czechoslovakia | Eastern/Southern Europe | 278,000 | 0.3% | 1937 | 14,429,000 | 1.9% | |
| Dutch East Indies | Colonies | Colonies-Asia | 3,400,000 | 4.0% | 1939 | 72,903,000 | 4.7% |
| Estonia | Eastern/Southern Europe | 81,000 | 0.1% | 1939 | 1,134,000 | 7.1% | |
| Ethiopia | Colonies | Colonies-Africa | 100,000 | 0.1% | 1934 | 12,000,000 | 0.8% |
| Finland | Western imperialist allies | 97,000 | 0.1% | 1938 | 3,656,000 | 2.7% | |
| France | Western imperialist allies | 600,000 | 0.7% | 1938 | 41,960,000 | 1.4% | |
| French Indochina | Colonies | Colonies-Asia | 1,500,000 | 1.8% | 1939 | 23,000,000 | 6.5% |
| Germany | Axis | Axis | 7,619,000 | 8.9% | 1938 | 68,558,000 | 11.1% |
| Greece | Eastern/Southern Europe | 807,000 | 0.9% | 1939 | 7,156,000 | 11.3% | |
| Hungary | Eastern/Southern Europe | 634,000 | 0.7% | 1939 | 9,227,000 | 6.9% | |
| India (British India) | Colonies | Colonies-Asia | 3,000,000 | 3.5% | 1939 | 381,400,000 | 0.8% |
| Italy | Axis | Axis | 486,000 | 0.6% | 1939 | 43,865,000 | 1.1% |
| Japan | Axis | Axis | 2,902,000 | 3.4% | 1936 | 70,171,000 | 4.1% |
| Korea | Colonies | Colonies-Asia | 483,000 | 0.6% | 1936 | 21,374,000 | 2.3% |
| Malaya & Singapore | Colonies | Colonies-Asia | 150,000 | 0.2% | 1939 | 5,317,000 | 2.8% |
| Netherlands | Western imperialist allies | 301,000 | 0.4% | 1939 | 8,782,000 | 3.4% | |
| New Zealand | Western imperialist allies | 13,000 | 0.0% | 1939 | 1,627,000 | 0.8% | |
| Norway | Western imperialist allies | 11,000 | 0.0% | 1939 | 2,954,000 | 0.4% | |
| Papua and New Guinea | Other | 20,000 | 0.0% | 1939 | 1,292,000 | 1.5% | |
| Philippines | Colonies | Colonies-Asia | 765,000 | 0.9% | 1939 | 16,275,000 | 4.7% |
| Poland | Eastern/Southern Europe | 5,720,000 | 6.7% | 1938 | 31,062,000 | 18.4% | |
| Portuguese Timor | Other | 70,000 | 0.1% | 1939 | 480,000 | 14.6% | |
| Romania | Eastern/Southern Europe | 833,000 | 1.0% | 1939 | 15,751,000 | 5.3% | |
| Ruanda-Urundi | Colonies | Colonies-Africa | 50,000 | 0.1% | 1939 | 3,800,000 | 1.3% |
| South Africa | Other | 14,000 | 0.0% | 1939 | 10,160,000 | 0.1% | |
| USSR | USSR + China | 27,000,000 | 31.6% | 1940 | 195,970,000 | 13.8% | |
| United Kingdom | Anglo America | 432,000 | 0.5% | 1938 | 47,494,000 | 0.9% | |
| United States | Anglo America | 415,000 | 0.5% | 1940 | 132,637,000 | 0.3% | |
| Yugoslavia | Eastern/Southern Europe | 1,021,000 | 1.2% | 1940 | 16,300,000 | 6.3% | |
|
Note: All figures cited with specific sources represent documented data from the referenced materials; all other data presented in this appendix are the author’s elaborations based on available estimates and methodological calculations described in Section 2.
|
|||||||
Reader’s Guide to the Four-Layer Endnotes
Part I: How to Read the Four-Layer Endnotes
The Four-Layer Structure of Each Endnote
Each endnote contains multiple layers of information, though only three are visible to readers.
What Each Layer Means
- Layer 1: Context – interpretive framing that explains why this evidence is important
- Layer 2: Verifiable claim – specific facts that can be independently verified
- Layer 3: Sources – where to verify the facts with exact page numbers
- Layer 4: Evidence – research methodology that exists in the database but is not published
Note on claim numbering: Claims are numbered X001, N002, and so on, but the numbering is not consecutive (e.g., 1, 9, 47). This reflects an iterative multi-team research approach in which some claims were merged, moved, or deprecated during the writing process. The gaps are normal.
Example Endnote:
Following the Data Trail: A Simple Example
Main text states: ‘China suffered 24.05 million deaths’
Endnote provides: Basic sources and context
Appendix explains:
- How the 24.05 million was calculated
- Why it differs from Western estimates
- Which sources were used and why
The following section provides methodological context for academic readers.
Part II: Methodology and Principles
Understanding the Research Methodology
This document uses a forensic historiography approach – investigating gaps and erasures in historical records rather than simply accepting established narratives. The endnotes reflect this methodology through a system that separates interpretation from facts and prioritises evidence from the nations that suffered the losses.
Key Methodological Innovations
1. Investigating Erasure, Not Just Recording Events
The research identifies two types of erasure:
- Undercounted deaths – millions missing from mainstream accounts
- Ignored evidence – facts that exist in archives but rarely appear in mainstream histories
2. Temporal Reframing
By starting the World Anti-Fascist War (WAFW) in 1931 (Japan’s invasion of China) rather than 1939, the methodology reveals eight years of resistance erased by Western periodisation.
3. Transparency Through Layers
Unlike traditional footnotes that mix everything together, this endnotes system:
- Separates interpretation from facts
- Documents methodology (even if not published)
- Enables verification at multiple levels
- Shows when sources conflict and explains choices
Critical Reading Questions
As you read, consider:
- Whose voices are centred? Notice when documentation from victim nations takes precedence over that of external observers.
- What is being recovered? Many of the facts presented existed in archives but were omitted from mainstream narratives.
- Why do numbers differ? When you see conflicting estimates, the appendix explains which was chosen and why.
- What remains unknown? The methodology acknowledges when records were destroyed (as in Burma) and evidence cannot be recovered.
Source Prioritisation and Why It Matters
The Source Hierarchy: A Holistic Approach
This research systematically considered various sources:
- Primary sources from victim nations – Chinese government surveys, Soviet archives, Vietnamese records
- Scholarship from affected countries – historians with access to local archives and languages
- International investigations – UN reports, war crimes tribunals
- Western sources citing primary evidence – academic works properly documenting original sources
- Western sources for comparison – to establish what mainstream narratives claim
Why This Prioritisation?
Victim nations had better direct access to the information needed to document their own losses. The figure of 24.05 million Chinese deaths comes from historian Bian Xiuyue of the Chinese Academy of Social Sciences, whose 2012 book documents approximately 23.6 million deaths from 1937 to 1945, plus the author’s estimate of 450,000 deaths from 1931 to 1937. Separately, the Chinese government’s decade-long survey documented 35 million total casualties (including both dead and wounded). When comprehensive victim-nation research shows 24.05 million deaths while Western estimates show only 14–20 million, the discrepancy reveals systematic undercounting in mainstream historiography. The methodology prioritises rigorous scholarship and surveys from affected nations over external estimates.
Strategic Use of Perpetrator Admissions
When perpetrators admit damaging facts, these serve as conservative baselines. For example, when British Colonial Office records admit a 10% mortality rate in Nigerian tin mines, the actual rate was likely higher. Even the minimum admissions reveal severe exploitation.
Understanding Conservative Estimates
Throughout this work, the methodology generally uses conservative estimates from victim nations’ own documentation, though the approach varies based on available evidence and attribution challenges. This means:
- The actual human cost was likely higher than stated.
- Even these minimum figures reveal systematic erasure.
- Conservative numbers typically strengthen arguments, but the selection process reflects evidentiary complexities.
- When ranges exist, the methodology varies by case: for Africa, using 1.6 million (from a 1.6–2.0 million range) reflects the challenge of determining which deaths are primarily attributable to the war versus other causes – a question that remains understudied despite almost equal likelihood of higher numbers; for Indochina, using 1.5 million reflects documented undercounting; for the Philippines, using 765,000 (a midpoint) balances sources suggesting even higher figures.
The Substantive Innovation: Connecting Buried Evidence
Beyond the methodological innovations, this research assembles scattered and minimised evidence into a coherent pattern that reveals the West’s strategies.
Corporate Complicity
- IBM’s Thomas Watson befriended US President Franklin D. Roosevelt while receiving Hitler’s medals and automating the Holocaust with punch card systems.
- General Motors claimed tax write-offs for Wehrmacht truck factories while producing vehicles that invaded the Soviet Union.
- Two hundred and fifty US corporations operated in Nazi Germany as late as 1941.
Protection of War Criminals
- Churchill’s secret memos ordered protection of Italy’s highest-ranking war criminals, including Badoglio.
- General Douglas MacArthur freed all 3,607 Unit 731 members who tortured prisoners to death, paying them for their data.
- Nobusuke Kishi went from war criminal to prime minister in nine years with CIA orchestration.
Strategic Calculations
- The atomic bombings targeted Soviet and Chinese influence more than Japan – which was already defeated.
- The Second Front was systematically delayed by 730 days while the Soviet Union bled.
- Lend-Lease aid reveals a racial calculus: whites received $442 per person; non-whites received $4.40 per person – a 101:1 ratio.
The Death Rate Arithmetic
- Socialist forces: 59.8% of all WAFW deaths
- Colonised peoples: 13.1% of deaths
- Anglo-Americans: 1% of deaths
- This pattern continued through Korea (92% Korean/Chinese deaths) and Vietnam (98% Southeast Asian deaths)
These documented facts, usually scattered across specialised archives and minimised in mainstream histories, are brought together here with full citations. The endnotes don’t just provide sources – they reveal a systematic pattern of complicity that mainstream narratives work to obscure.
Understanding the Appendix Structure
The appendix provides complete transparency through three sections:
Section 1: Data Tables and Sources for Figures
Clean presentation of the data as it appears in the main text, with source attribution.
Section 2: Methodological Notes
Detailed explanations of:
- How calculations were performed
- Why certain sources were chosen over others
- How conflicting estimates were resolved
- What assumptions were made and why
- Conservative estimation principles
Section 3: Verbatim Data Source Excerpts
Original tables reproduced exactly as they appear in primary sources, allowing readers to verify all calculations themselves.
Part III: Research Infrastructure and Technical Infrastructure: Industrial-Strength Citation Management
For researchers interested in replicating the methodology or understanding the full scope of findings.
Abstract
This section documents a novel research infrastructure combining Zotero with supplemental software and development practices to manage more than 200 claims and more than 400 citations across a globally distributed research team. The system enforces the same four-layer separation of concerns defined in Part I (here presented from a workflow perspective: interpretation, facts, sources, methodology) while maintaining complete verification trails.
System Architecture
Core Components
1. Zotero as Data Layer
- Case items – store claims with four-layer structured notes
- Book Section items only – every citation requires specific page numbers
- Map items – shared research reports and methodology documentation
- Flat repository structure – sequential numbering (80WAFW-001 through 80WAFW-999)
2. Four-Layer Separation
- Layer 1: Context (interpretive) → published
- Layer 2: Verifiable claim (factual) → published
- Layer 3: Sources (citations) → published
- Layer 4: Evidence (methodology and verification) → archived
3. Verification Infrastructure
- Software-assisted initial verification (pattern detection at scale)
- Mandatory paired human review (catches systematic biases)
- Colour-coded tracking (green, orange, yellow, red flags)
- Consensus requirement before approval
- Full audit trail in Layer 3
Key Technical Innovations
Book-Sections-Only Architecture for Books
Every book citation is a complete Book Section with full metadata. Benefits:
- Self-contained records (no dependency failures)
- Bibliography creation software code automatically de-duplicates
- Simpler export/import pipelines
- Each citation links to multiple claims via the Extra field
Structured Note Templates
Every case item requires a note with an exact structure:
- Claim ID: X001
- Claim name: [descriptive]
- Claim context: [Layer 1 – interpretive]
- Verifiable claim: [Layer 2 – factual]
- Claim sources: [Layer 3 – citations]
- Claim evidence: [Layer 4 – methodology]
- Verification note: [paired review documentation]
- Additional information: [optional]
Software Pipeline
Export Infrastructure
- Zotero → CSV (v63 script): Extracts four-layer structure, generates Chicago-style notes formatting
- CSV → Word (VBA v64): UTF-8 handling, DOCX fallback, publication-ready endnotes
Version Control Strategy
- Dedicated backup machine with snapshots
- Collection-level RDF exports
- Deprecation collections (never delete)
- External metadata tracking in spreadsheets, json and markdown files.
Review Process
- Software-assisted systems enable four rounds of review of claims and citations to address the many conflicting facts and interpretations. Each round included extensive review by researchers.
Implementation Requirements
Technical Stack
- Zotero 6+ with Better BibTeX
- Node.js for export scripts
- Excel or LibreOffice for CSV manipulation
- Word with VBA support
- Cloud storage for PDF repository
Conclusion
This methodology demonstrates how historical research can benefit from software development best practices while maintaining scholarly rigour. The four-layer architecture enables teams to challenge established narratives through systematic, transparent, and reproducible research.
Key Takeaways for Researchers:
- Separation of concerns (interpretation, facts, sources, methodology) improves clarity
- Structured data enables verification at scale
- Multiple stages of review catch systematic biases
- Comprehensive source evaluation strengthens claims
- Complete audit trails defend controversial findings
The infrastructure investment pays dividends when defending research that challenges dominant historiography.
Endnotes
Bibliography
Abebaw Ejigu, Tesfaw [ተስፋው አበባው እጅጉ]. ‘The Overlooked Roles of Women in the Patriotic Resistance Movement in Bure Damot, 1936–1941’. Cogent Arts and Humanities 11, no. 1 (2024). https://doi.org/10.1080/23311983.2024.2390786.
Acemoglu, Daron, Giuseppe De Feo, Giacomo De Luca, and Gianluca Russo. ‘War, Socialism, and the Rise of Fascism: An Empirical Exploration’. The Quarterly Journal of Economics 137, no. 2 (2022). https://doi.org/10.1093/qje/qjac001.
Agayev, Vagif [Вагиф Агаев], Fuad Akhundov [Фуад Ахундов], Aliyev Fikrat T. [Фикрет Алиев], and Mikhail Agarunov [Михаил Агарунов]. ‘World War II and Azerbaijan’. Azerbaijan International Magazine, 1995.
Alawad Sikainga, Ahmad [أحمد العوض سيكانغا]. ‘Sudanese Popular Response to World War II’. In Africa and World War II. Cambridge University Press, 2015.
Alexander, Arthur J. Armor Development in the Soviet Union and the United States. R-1860-NA. Rand, 1976. https://www.rand.org/content/dam/rand/pubs/reports/2006/R1860.pdf.
Allen, Jay. ‘Slaughter of 4,000 at Badajoz, “City of Horrors”, Is Told by Tribune Man’. Chicago Tribune, 30 August 1936.
Alperovitz, Gar. Atomic Diplomacy: Hiroshima and Potsdam; The Use of the Atomic Bomb and the American Confrontation with Soviet Power. New York: Vintage Books (A Division of Random House), 1965.
Alperovitz, Gar. The Decision to Use the Atomic Bomb and the Architecture of an American Myth. New York: A. A. Knopf, 1995.
Anderson, Irvine H. The Standard-Vacuum Oil Company and United States East Asian Policy, 1933–1941. Princeton, NJ: Princeton University Press, 1975.
Anderson, Thomas. Ferdinand and Elefant Tank Destroyer. London: Bloomsbury Publishing Plc, 2015.
Andreev, Evgeny M. [Андреев, Евгений М. ], Darsky, Leonid E. [Дарский, Леонид Евсеевич], Kharkova, Tatiana L. [Харькова, Татьяна Л. ], and Institute of National Economic Forecasting [Институт народнохозяйственного прогнозирования]. Population of the Soviet Union: 1922–1991 [Население Советского Союза: 1922–1991]. Moscow: Science [Наука], 1993.
Arolsen Archives. ‘Prisoner Groups in the Concentration Camp: How the Nazis Stigmatised Their Victims’. Arolsen Archives, 23 November 2023. https://arolsen-archives.org/en/news/prisoner-groups-in-the-concentration-camp-how-the-nazis-stigmatized-their-victims/.
Assistant Secretary of State for Occupied Areas (Saltzman) to the United States Member of the Far Eastern Commission (McCoy). Washington, DC: United States Government Printing Office, 1976.
Associated Press. ‘Hitler Granted 4-Year Term as Supreme Ruler’. The Seattle Daily Times (Seattle, WA), 24 March 1933.
Bartels, Eckhart. Opel Military Vehicles, 1906–1956. Atglen: Schiffer Publishing, 1997.
Beevor, Antony. The Battle for Spain: The Spanish Civil War 1936–1939. East Rutherford, NJ: Penguin Publishing Group, 2006.
Beevor, Antony. The Second World War. London: Weidenfeld & Nicolson, 2012.
Berra, Peter. Photo of Identification Badge of a Political Prisoner in Nazi Camps. 17 July 2020. Montreal Holocaust Museum. https://museeholocauste.ca/en/objects/identification-badge-of-a-political-prisoner-nazi-camps/.
Bian, Xiuyue [卞修跃]. 抗日战争时期中国人口损失问题研究 (1937–1945) [Research on China’s Population Losses During the War of Resistance Against Japan (1937–1945)]. Beijing: Hualing Publishing House [华龄出版社], 2012.
Black, Edwin. IBM and the Holocaust: The Strategic Alliance Between Nazi Germany and America’s Most Powerful Corporation, Expanded edition. Washington, DC: Dialog Press, 2012.
Blackett, P. M. S. Fear, War, and the Bomb: Military and Political Consequences of Atomic Energy. New York: Whittlesey House, McGraw-Hill Book Company, Inc., 1949.
Blouet, Brian W. Halford Mackinder: A Biography. Texas A&M University Press, 1987.
Bộ, Quốc phòng, Viện Lịch sử Quân sự Việt Nam [Ministry of National Defence, Vietnam Military History Institute]. Lịch sử Kháng chiến Chống Mỹ, Cứu nước (1954–1975), Tập VIII: Toàn thắng [History of the Resistance War Against the Americans to Save the Nation (1954–1975), vol. VIII: Total Victory], vol. VIII. Hanoi: Nhà xuất bản Chính trị Quốc gia [National Political Publishing House], 2008.
Braden, Thomas W. ‘I’m Glad the CIA Is “Immoral”’. The Saturday Evening Post, 20 May 1967.
Branscum, Michael. ‘Nazism in the 1933 Seattle Times’. Civil Rights and Labor History Consortium/University of Washington, 2009. https://depts.washington.edu/depress/nazi_seattle_times.shtml.
Budge, Kent G. ‘French Indochina’. In The Pacific War Online Encyclopedia. 2014. http://www.pwencycl.kgbudge.com/F/r/French_Indochina.htm.
Byfield, Judith and Hailu Habtu [ሃይሉ ሀብቱ]. ‘Fighting Fascism: Ethiopian Women Patriots 1935–1941’. In Africa and World War II, edited by Carolyn A. Brown, Judith A. Byfield, Timothy Parsons, and Ahmad Alawad Sikainga [أحمد العوض سيكانغا]. Cambridge University Press, 2015.
Carley, Michael Jabara. 1939: The Alliance That Never Was and the Coming of World War II. Chicago, IL: Ivan R. Dee Publisher, 1999.
Casanova, Julián, Francisco Espinosa, Conxita Mir, and Francisco Moreno. Morir, matar, sobrevivir: la violencia en la dictadura de Franco [Die, Kill, Survive: Violence Franco’s Dictatorship]. Barcelona: Crítica, 2002.
Cernadas, Gisela, and John Bellamy Foster. ‘Actual US Military Spending Reached $1.537 Trillion in 2022 – More than Twice Acknowledged Level: New Estimates Based on U.S. National Accounts’. Monthly Review 75, no. 6 (2023). https://monthlyreview.org/articles/actual-u-s-military-spending-reached-1-53-trillion-in-2022-more-than-twice-acknowledged-level-new-estimates-based-on-u-s-national-accounts/.
Cernadas, Gisela, Mikaela Nhondo Erskog, Tica Moreno, and Deborah Veneziale. Hyper-Imperialism: A Dangerous Decadent New Stage. Tricontinental: Institute for Social Research, 2024.
CGTN. ‘Ranzhuang Tunnel Warfare Site: A Key Relic from the War of Resistance’. 29 July 2025. https://news.cgtn.com/news/2025-07-29/Ranzhuang-Tunnel-Warfare-Site-A-key-relic-from-the-War-of-Resistance-1FoUNZF1iV2/p.html.
Chang, Iris. The Rape of Nanking: The Forgotten Holocaust of World War II, 1st edition. New York: Basic Books, 1997.
Chen, Mo [陈默], Wang Qisheng [王奇生], Bu Ping [步平], and Wang Jianlang [王建朗]. 中国抗日战争史 [A History of the Chinese War of Resistance Against Japanese Aggression], vol. 4. Beijing: Social Sciences Academic Press [社会科学文献出版社], 2019.
Churchill, Winston S. ‘War Situation’. House of Commons Debate, 9 September 1941. Cc67–156. vol. 374. https://api.parliament.uk/historic-hansard/commons/1941/sep/09/war-situation.
Churchill, Winston S. ‘The Second World War: The Hinge of Fate’. In The Second World War, vol. 4. Cassell, 1951.
Cohen, Jerome B. Japan’s Economy War and Reconstruction. Minneapolis: University of Minnesota Press, 1949.
Cole, Joshua. ‘Massacres and Their Historians: Recent Histories of State Violence in France and Algeria in the Twentieth Century’. French Politics, Culture & Society 28, no. 1 (2010).
Committee on International Relations, US House of Representatives. ‘Marshall Testimony of February 20, 1945, Ongoing US Military Aid for China’. In Selected Executive Session Hearings of the Committee, 1943–50, United States Policy in the Far East, Part I, vol. 7. 80th Cong., 2d Sess., 1948. US Government Printing Office, 1976.
Cribb, Robert B. ‘Unresolved Problems Indonesian Killings of 1965–1966’. Asian Survey 42, no. 4 (2002). https://doi.org/10.1525/as.2002.42.4.550.
Cumings, Bruce. The Korean War: A History. New York: Random House Publishing Group, 2010.
De Jong, David. Nazi Billionaires: The Dark History of Germany’s Wealthiest Dynasties. London: William Collins, 2022.
Del Boca, Angelo. The Ethiopian War 1935–1941. Chicago, IL: University of Chicago Press, 1969.
Di, Chenchen [弟辰晨], Deng Yumeng [邓雨萌], and Liu Jingjing [刘京京]. ‘铭记历史!关于南京大屠杀你必须知道的 – 组数字 [Remember History! A Set of Numbers You Must Know About the Nanjing Massacre]’. CCTV, 13 December 2021. https://news.cctv.com/2021/12/13/ARTICqBUdzd0ORXhQX20fKMv211213.shtml.
Dower, John W. Embracing Defeat: Japan the Wake of World War II. New York: Norton New Press, 1999.
Driscoll, Mark. Absolute Erotic, Absolute Grotesque: the Living, Dead, and Undead Japan’s Imperialism 1895–1945. Durham, NC: Duke University Press, 2010.
Dunn, Walter S. The Soviet Economy and the Red Army, 1930–1945. Westport, CN: Praeger Publishers, 1995.
Dunton, Mark. ‘Vital Words of Hope, 26 May 1940’. UK Government. The National Archives, 26 May 2020. https://webarchive.nationalarchives.gov.uk/ukgwa/20250613144333/https://blog.nationalarchives.gov.uk/vital-words-of-hope-26-may-1940/.
Early, Stephen. ‘Cairo Communiqué’. National Diet Library, 1 December 1943. https://www.ndl.go.jp/constitution/e/shiryo/01/002_46/002_46tx.html.
Eisenhower, Dwight D. Mandate for Change, 1953–1956. New York: Doubleday & Company, Inc., 1963.
Ellman, Michael, and Sergei Maksudov. ‘Soviet Deaths in the Great Patriotic War: A Note’. Europe-Asia Studies 46, no. 4 (1994). https://doi.org/10.1080/09668139408412190.
Eng, Pierre van der. ‘Missing Millions: Java’s 1944–45 Famine in Indonesia’s Historiography’. Modern Asian Studies 58, no. 2 (2024).
Eng, Pierre van der. ‘Mortality from the 1944–1945 Famine in Java, Indonesia’. Asia-Pacific Economic History Review, 5 February 2024.
Ericson, Edward E. Feeding the German Eagle: Soviet Economic Aid to Nazi Germany, 1933–1941. Westport, CN: Praeger Publishers, 30 November 1999.
Feis, Herbert. The Road to Pearl Harbor: The Coming of the War Between the United States and Japan. Princeton University Press, 1950.
Fernandes, Marco. ‘Nobody Is Forgotten, Nothing Is Forgotten: The 80th Anniversary of a Victory Still Contested’. Peoples Dispatch, 21 May 2025. https://peoplesdispatch.org/2025/05/21/nobody-is-forgotten-nothing-is-forgotten-the-80th-anniversary-of-a-victory-still-contested/.
Field, Alexander J. The Economic Consequences of US Mobilisation for the Second World War. New Haven, CT: Yale University Press, 2022.
Foglesong, David S. America’s Secret War Against Bolshevism: US Intervention the Russian Civil War, 1917–1920. Chapel Hill, NC: University of North Carolina Press, 1995.
Foster, John Bellamy. ‘Revolution and Counterrevolution, 1917–2017’. Monthly Review 69, no. 03 (2017). https://monthlyreview.org/articles/revolution-and-counterrevolution-1917-2017/.
Foster, John Bellamy. ‘The US Quest for Nuclear Primacy: The Counterforce Doctrine and the Ideology of Moral Asymmetry’. Monthly Review 75, no. 09 (2024). https://monthlyreview.org/articles/the-u-s-quest-for-nuclear-primacy/.
Franzinelli, Mimmo. Squadristi: protagonisti e tecniche della violenza fascista 1919–1922 [Squadristi: Protagonists and Techniques of Fascist Violence 1919–1922]. Milano: Feltrinelli, 2019.
German Criminal Police. ‘Communist Party Functionaries Wanted by the German Criminal Police (1933)’. German History in Documents and Images (GHDI), 1933. https://ghdi.ghi-dc.org/sub_image.cfm?image_id=1880.
German Historical Institute Washington. ‘Table of Coloured Classification Symbols for Prisoners in Concentration Camps (c. 1938–1944)’. Accessed 3 September 2025. https://germanhistorydocs.org/en/nazi-germany-1933-1945/table-of-colored-classification-symbols-for-prisoners-in-concentration-camps-1939-1942.
Glantz, David. Barbarossa Derailed: The Battle for Smolensk, vol. 1. Solihull: Helion & Company, 2 November 2010.
Glantz, David M. Stumbling Colossus: The Red Army on the Eve of World War. Lawrence, KS: University Press of Kansas, 1998.
Glantz, David M. Barbarossa: Hitler’s Invasion of Russia, 1941. Stroud: Tempus, 2001.
Glantz, David M. ‘The Soviet-German War 1941–1945: Myths and Realities: A Survey Essay’. Clemson University, 11 October 2001.
Glantz, David M., and Jonathan M. House. When Titans Clashed: How the Red Army Stopped Hitler. Lawrence, KS: University Press of Kansas, 2015.
Golinkin, Lev. ‘Nazi Monuments Around the World’. The Forward, 27 January 2021. https://forward.com/news/462648/how-many-monuments-honor-fascists-nazis-and-murderers-of-jews-youll-be/.
Grand, Alexander De. ‘Mussolini’s Follies: Fascism in Its Imperial and Racist Phase, 1935–1940’. Contemporary European History 13, no. 2 (2004). https://doi.org/10.1017/S0960777304001602.
Grip, Lina, and John Hart. ‘The Use of Chemical Weapons in the 1935–36 Italo-Ethiopian War’. SIPRI Arms Control and Non-Proliferation Programmme, October 2009.
Gruhl, W. Imperial Japan’s World War Two: 1931–1945. New Brunswick, NJ: Transaction Publishers, 2007.
Guryev, E.P. [Гурьев, Е. П. ], and Kondratenko, S. Yu. [Кондратенко, С. Ю. ]. Советский Союз во Второй мировой войне [The Soviet Union World War II]. Moscow: Connection of Epochs Foundation [Фонд «Связь Эпох»], 2023.
Halliday, Jon, and Bruce Cumings. Korea: The Unknown War, 1st American edition. New York: Pantheon, 1988.
Harrison, Mark. Accounting for War: Soviet Production, Employment, and the Defence Burden, 1940–1945. Cambridge, MA: Cambridge University Press, 1996.
Harrison, Mark. The Economics of World War II: Six Great Powers International Comparison. Cambridge University Press, 1998.
Harrison, Mark. ‘Counting the Soviet Union’s War Dead: Still 26–27 Million’. Europe-Asia Studies 71, no. 6 (2018). https://doi.org/10.1080/09668136.2018.1547366.
Hasegawa, Tsuyoshi. Racing the Enemy: Stalin, Truman, and the Surrender of Japan. Cambridge, MA: The Belknap Press of Harvard University Press, 2005.
Haynes, Michael. ‘Counting Soviet Deaths in the Great Patriotic War: A Note’. Europe-Asia Studies 55, no. 2 (2003). https://doi.org/10.1080/0966813032000055895.
Hayward, Joel. ‘Too Little, Too Late: An Analysis of Hitler’s Failure in August 1942 to Damage Soviet Oil Production’. Journal of Military History 64, no. 3 (2000).
Henderson, Neville. Failure of a Mission: Berlin 1937–1939. New York: G. P. Putnam’s Sons, 1940.
Herman, Margaux. ‘Women and War’. In History of Women in Ethiopia. Centre Français des Études Éthiopiennes, 2024.
Highsmith, Carol. ‘Inscription Noting the Death Toll for the US and Its United Nations Allies at the Korean War Veterans Memorial in Washington, D.C.’ Library of Congress Prints and Photographs Division Washington, D.C., 2006 1998. http://hdl.loc.gov/loc.pnp/highsm.14308.
Hillsdale College. ‘Bolshevism: “Foul Baboonery…Strangle at Birth”’. The Churchill Project, 11 March 2016. https://winstonchurchill.hillsdale.edu/bolshevism/#_ftnref3.
Hitchens, Christopher. ‘Chamberlain: Collusion, Not Appeasement’. Monthly Review 46, no. 8 (1995). https://doi.org/10.14452/MR-046-08-1995-01_3.
Huang, Daoxuan [黄道炫], Wang Xiliang [王希亮], Bu Ping [步平], and Wang Jianlang [王建朗]. 中国抗日战争史: 第 – 卷 局部抗战 [A History of the Chinese War of Resistance Against Japanese Aggression: vol. 1, The Localised War of Resistance], vol. 1. Beijing: Social Sciences Academic Press (China) [社会科学文献出版社], 2019.
Huff, Gregg. World War II and Southeast Asia: Economy and Society Under Japanese Occupation. Cambridge, UK: Cambridge University Press, 2020.
Hughes, Thomas A, and John Graham Royde-Smith. ‘World War II: Facts, Summary, History, Dates, Combatants, and Causes’. In Encyclopaedia Britannica. 9 September 2025. https://www.britannica.com/event/World-War-II.
Human Rights Watch. ‘Indonesia: US Documents Released on 1965–66 Massacres’. Human Rights Watch, 18 October 2017. https://www.hrw.org/news/2017/10/18/indonesia-us-documents-released-1965-66-massacres.
Imperial War Museums. ‘Operation “Barbarossa” And Germany’s Failure In The Soviet Union’. Accessed 26 September 2025. https://www.iwm.org.uk/history/operation-barbarossa-and-germanys-failure-in-the-soviet-union.
Imperial War Museums. ‘The German Response to D-Day’. Imperial War Museums, 13 September 2025. https://www.iwm.org.uk/history/the-german-response-to-d-day.
Jackson, Ashley. The British Empire and the Second World War. London: Hambledon Continuum, 2006.
Jungbluth, Rüdiger. The Quandts: Their Quiet Rise to Germany’s Most Powerful Economic Dynasty [Die Quandts: Ihr Leiser Aufstieg zur mächtigsten Wirtschaftsdynastie Deutschlands]. Cologne: Bastei Lübbe, 2004.
Kammen, Douglas. ‘Population Loss in Portuguese Timor During WW2 Revisited’. New Mandala, 30 October 2024. https://www.newmandala.org/population-loss-in-portuguese-timor-during-ww2-revisited/.
Keegan, John. ‘Germany 1945’. In The Times Atlas of the Second World War. Times Books, 1989.
Khenouf, Mohamed [محمد خنوف], and Michael Brett. ‘Algerian Nationalism and the Allied Military Strategy and Propaganda during the Second World War: The Background to Setif’. In Africa and the Second World War. Palgrave Macmillan, 1986.
Killingray, David, and Richard Rathbone. Africa and the Second World War, 1st edition. London: Palgrave Macmillan UK, 1986.
Kohn, Richard H., and Joseph P. Harahan. Strategic Air Warfare: An Interview with Generals Curtis E. LeMay, Leon W. Johnson, David A. Burchinal, and Jack J. Catton. Office of Air Force History, US Air Force, 1988.
Kolko, Gabriel. The Politics of War: The World and United States Foreign Policy, 1943–1945, Reprint. New York: Pantheon Books, 1990.
Kraus, Theresa L. China Offensive May – 2 September 1945. CMH Pub 72–39. US Army Campaigns of World War II. US Army Center of Military History, 1996.
Krukones, James H. ‘The Unspooling of Artkino: Soviet Film Distribution in America, 1940–1975 ’. History, no. 36 (2009).
Kuhn, Anthony, dir. ‘Okinawa’s Peace Movement Struggles as Military Presence on the Islands Grows’. All Things Considered. NPR, 9 April 2024. https://www.npr.org/2024/04/09/1243752613/okinawas-peace-movement-struggles-as-military-presence-on-the-islands-grows.
KZ Gedenkstätte Dachau. ‘Dachau Concentration Camp Memorial Site’. 11 September 2025. https://www.kz-gedenkstaette-dachau.de/en/.
Lazarsfeld, Paul F., and Wagner Thielens. The Academic Mind: Social Scientists a Time of Crisis. New York: Arno Press, 1958.
Leahy, William D. I Was There: The Personal Story of the Chief of Staff to Presidents Roosevelt and Truman Based on His Notes and Diaries Made at the Time. New York: Whittlesey House, McGraw-Hill Book Company, Inc., 1950.
Leibovitz, Clement, and Alvin Finkel. The Chamberlain-Hitler Collusion. New York: Monthly Review Press, 1997.
Lengel, Edward G. ‘The Greek Civil War, 1944–1949’. The National WWII Museum, 22 May 2020. https://www.nationalww2museum.org/war/articles/greek-civil-war-1944-1949.
Leslie, Stuart W. The Cold War and American Science: The Military-Industrial-Academic Complex at MIT and Stanford. New York: Columbia University Press, 1993.
Liang, Xinlei [梁馨蕾]. ‘革命“苦履”:中共军队的草鞋历史与记忆 [Revolutionary “Bitter Footwear”: The History and Memory of Straw Sandals of the CPC Army]’. Studies in CPC History [中共党史研究], no. 1 (2024). https://sxyk.henu.edu.cn/info/1014/4603.htm.
Lin, Zhibo [林治波], and Zhao Guozhang [赵国章]. 大捷 – 台儿庄战役实录 [Great Victory – A Factual Record of the Battle of Taierzhuang], 1st edition. Guilin: Guangxi Normal University Press [广西师范大学出版社], 1996.
Linz, Susan J. World War II and Soviet Economic Growth 1940–1953. Working Paper No. 1038. BEBR Faculty Working Paper. University of Illinois at Urbana-Champaign, 1984. http://archive.org/details/worldwariisoviet1038linz.
Li, Xia. ‘China Holds Burial Ceremony for Soldier Remains Returned from ROK’. Xinhua News Agency, 4 April 2019. https://www.xinhuanet.com/english/2019-04/04/c_137949939.htm.
Li, Zhongjie [李忠杰], Li Rong [李蓉], Yao Jinguo [姚金果], Huo Haidan [霍海丹], and Jiang Jiannong [蒋建农]. 抗日战争时期中国人口伤亡和财产损失调研丛书 [Research Series on Chinese Casualties and Property Losses During the War of Resistance Against Japan]. Beijing: 中共党史出版社 [CPC Party History Publishing House], 2014.
Logevall, Fredrik. Embers of War: The Fall of an Empire and the Making of America’s Vietnam, 1st edition. New York: Random House, 2012.
Lunn, Joe. ‘Africans in World Wars I and II’. Oxford Research Encyclopedia of African History, March 2019. https://doi.org/10.1093/acrefore/9780190277734.013.42.
MacArthur, Douglas. ‘Telegram General of the Army Douglas MacArthur to the Chief of Staff, United States Army (Eisenhower)’. In Foreign Relations of the United States, 1946, The Far East, vol. 8. United States Government Printing Office, 1971. https://history.state.gov/historicaldocuments/frus1946v08/d308.
‘Maddison Database 2010 | Releases | Groningen Growth and Development Centre | University of Groningen’. Accessed 1 September 2025. https://www.rug.nl/ggdc/historicaldevelopment/maddison/releases/maddison-database-2010.
Malkov, P. V. The Great Patriotic War: The Anniversary Statistical Handbook. Moscow: Federal State Statistics Service, 2020.
Manley, Rebecca. To the Tashkent Station: Evacuation and Survival the Soviet Union at War. Cornell University Press, 2009.
Mao, Zedong [毛泽东]. 论联合政府 [On Coalition Government], vol. 1. Beijing: People’s Publishing House [人民出版社], 1975.
Mazower, Mark. Hitler’s Empire: Nazi Rule Occupied Europe. London: Penguin, 2009.
McCall-Washington, Ashley N. ‘Surrender at Bataan Led to One of the Worst Atrocities in Modern Warfare’. USO, 14 November 2015. https://www.uso.org/stories/122-surrender-at-bataan-led-to-one-of-the-worst-atrocities-in-modern-warfare.
McDonough, Frank. Opposition and Resistance Nazi Germany. Cambridge University Press, 2001.
McLynn, Frank J. The Burma Campaign: Disaster into Triumph 1942–1945. New Haven, CT: Yale University press, 2011.
Messer, Robert L. The End of an Alliance: James F. Byrnes, Roosevelt, Truman, and the Origins of the Cold War. Chapel Hill, NC: University of North Carolina press, 1982.
Mirrlees, Tanner. The Militarisation of Movies and Television. Research Report. Costs of War Project. Watson Institute for International & Public Affairs, Brown University, 2025. https://watson.brown.edu/costsofwar/files/cow/imce/papers/2025/Militarization%20of%20Movies%20and%20TV_2.25.25_.pdf.
Mitter, Rana. Forgotten Ally: China’s World War II, 1937–1945. Boston, MA: Houghton Mifflin Harcourt, 2018.
Morrison, Philip. ‘Blackett’s Analysis of the Issues’. Bulletin of the Atomic Scientists 5, no. 2 (1949).
Mueller-Hillebrand, Burkhart. Das Heer 1933–1945: Der Zweifrontenkrieg: Das Heer vom Beginn des Feldzuges gegen die Sowjetunion bis zum Kriegsende. Band III. [The Two-Front War: The Army from the Beginning of the Campaign Against the Soviet Union until the End of the War]. Frankfurt am Main: E.S. Mittler & Sohn, 1956.
Mueller-Hillebrand, Burkhart. Das Heer 1933–1945: Entwicklung des organisatorischen Aufbaues. Band II: Die Blitzfeldzüge 1939–1941 [The Army 1933–1945: Development of the Organisational Structure. vol. II: The Blitz Campaigns 1939–1941]. Frankfurt am Main: E.S. Mittler & Sohn, 1956.
Mukerjee, Madhusree. Churchill’s Secret War: The British Empire and the Ravaging of India During World War II. New York: Basic Books, 2010.
Murayama, Tomiichi [村山富市]. ‘Statement by Prime Minister Tomiichi Murayama “On the Occasion of the 50th Anniversary of the War’s End”’. Ministry of Foreign Affairs of Japan, 15 August 1995. https://www.mofa.go.jp/announce/press/pm/murayama/9508.html.
Myers, Andrew. ‘A Period of Transformation 1955–1964’. 100 Years of Stanford Engineering. Accessed 13 September 2025. https://engineering100.stanford.edu/stories/a-period-of-transformation.
National Churchill Museum. ‘Churchill’s 1919 War Office Memorandum’. America’s National Churchill Museum, 12 May 1919. https://www.nationalchurchillmuseum.org/churchills-1919-war-office-memorandum.html.
National Guardian. ‘US Jams “Treaty” through; Gromyko Calls It War Threat’. National Guardian, 12 September 1951.
Neubauer. ‘The German Reichstag Elections’. International Press Correspondence, 10 November 1932. vol. 12, no. 50 Edition.
Nicosia, Francis R. Business and industry the Nazi Germany. New York: Berghahn Books, 2004.
Nie, Jingbao [聂精保], Guo Nanyan [郭南燕], Mark Selden, and Arthur Kleinman. Japan’s Wartime Medical Atrocities. Comparative Inquiries Science, History, and Ethics. London: Routledge, 2010.
Overy, Richard. Why the Allies Won. New York: W. W. Norton & Company, 1996.
Overy, Richard. Blood and Ruins: The Great Imperial War, 1931–1945. London: Penguin, 2023.
Pauwels, Jacques R. The Myth of the Good War: America the Second World War, Revised edition. Toronto: Lorimer, 2017.
Peattie, Mark R., Edward J. Drea, and Hans J. Van de Ven. The Battle for China: Essays on the Military History of the Sino-Japanese War of 1937–1945. Stanford, CA: Stanford University Press, 2011.
Piccigallo, Philip R. The Japanese on Trial: Allied War Crimes Operations the East, 1945–1951. Austin, TX: University of Texas Press, 2021.
Preston, Paul. The Spanish Holocaust: Inquisition and Extermination Twentieth-Century Spain. London: Harper Press, 2012.
Prosperi, Luigi. ‘The Missed Italian Nuremberg: The History of an Internationally-Sponsored Amnesty’. Paper presented at DEBACLES – Illusions and Failures in the History of International Adjudication, Max Planck Institute Luxembourg for Procedural Law. 25 November 2016. https://ssrn.com/abstract=2887267.
Putin, Vladimir [Владимир Путин]. ‘Vladimir Putin: Interview to Xinhua News Agency’. Ahead of His Official Visit to the People’s Republic of China, Vladimir Putin Gave a Written Interview to the Chinese News Agency Xinhua, 29 August 2025. http://en.kremlin.ru/events/president/news/77864.
Qi, Shirong [齐世荣]. 绥靖政策研究 [Research on Appeasement Policy]. Beijing Normal University Press [首都师范大学出版社], 1998.
Raymond, Jack. ‘21 Nazi Criminals Saved From Death; McCloy, Gen. Handy Commute Sentences as Clemency – 7 to Die – Krupp to Go Free’. Archives. The New York Times, 1 February 1951. https://www.nytimes.com/1951/02/01/archives/21-nazi-criminals-saved-from-death-mccloy-gen-handy-commute.html.
Rhodes, Richard. Masters of Death: The SS-Einsatzgruppen and the Invention of the Holocaust. New York: Alfred A. Knopf, 2002.
Rong, Weimu [荣维木], Wang Qisheng [王奇生], Bu Ping [步平], and Wang Jianlang [王建朗]. 中国抗日战争史:第⼆卷 战时军事 [A History of the Chinese War of Resistance Against Japanese Aggression: vol. 2, Wartime Military Operations], vol. 2. Beijing: Social Sciences Academic Press [社会科学文献出版社], 2019.
Roosevelt, Franklin D., and Winston S. Churchill. ‘The Atlantic Charter’. 14 August 1941. Franklin D. Roosevelt Presidential Library and Museum.
Rowberg, Richard. Federal R&D Funding: A Concise History. Nos 95–1209 STM. Congressional Research Service, 1998. https://www.everycrsreport.com/reports/95-1209.html.
Saluppo, Alessandro. ‘Paramilitary Violence and Fascism: Imaginaries and Practices of Squadrismo, 1919–1925’. Contemporary European History 29, no. 3 (2020). https://doi.org/10.1017/S0960777319000390.
Sampson, Anthony. The Sovereign State of ITT. Connecticut: Fawcett Publications, Inc., 1974.
Samuelson, Lennart. Tankograd: The Formation of a Soviet Company Town, Cheliabinsk, 1900s – 1950s. London: Palgrave Macmillan UK, 2011.
Saunders, Frances Stonor. The Cultural Cold War: The CIA and the World of Arts and Letters. New York: The New Press, 2013.
Schmitz, David F. Thank God They’re on Our Side: The United States and Right-Wing Dictatorships, 1921–1965. Chapel Hill, NC: University of North Carolina Press, 1999.
Sen, Amartya. ‘Starvation and Exchange Entitlements: A General Approach and Its Application to the Great Bengal Famine’. Cambridge Journal of Economics 1, no. 1 (1977). https://doi.org/10.1093/oxfordjournals.cje.a035349.
Sharples, Caroline. ‘What Do You Do with a Dead Nazi? Allied Policy on the Execution and Disposal of War Criminals, 1945–55’. In Transforming Occupation in the Western Zones of Germany: Politics, Everyday Life and Social Interactions, 1945–55, edited by Camilo Erlichmann and Christopher Knowles. Bloomsbury Academic, 2018. https://pure.roehampton.ac.uk/portal/en/publications/what-do-you-do-with-a-dead-nazi-allied-policy-on-the-execution-an.
Sher, Nathaniel. ‘Rethinking the “Loss of China”: US Involvement in the Chinese Civil War, 1945–1949’. Tsinghua International Relations Review 1, no. 1 (2021).
Sherry, Mark D. China Defensive July 1942–4 May 1945. CMH Pub 72–38. US Army Campaigns of World War II. US Army Center of Military History, 1996.
Shin, Eui Hang [신의항]. ‘Effects of the Korean War on Social Structures of the Republic of Korea’. International Journal of Korean Studies, Spring/Summer 2001.
Simpson, Brad. ‘US Embassy Tracked Indonesia Mass Murder 1965’. National Security Archive, 17 October 2017. https://nsarchive.gwu.edu/briefing-book/indonesia/2017-10-17/indonesia-mass-murder-1965-us-embassy-files.
Springhall, John. ‘“Kicking Out the Vietminh”: How Britain Allowed France to Reoccupy South Indochina, 1945–46’. Journal of Contemporary History 40, no. 1 (2005).
Stahl, Roger, dir. Theaters of War: How the Pentagon and CIA Took Hollywood. Produced by Matthew Alford. Media Education Foundation, 2022. 87 min. https://go.mediaed.org/theaters-of-war.
Stalin, J. V. ‘Memorandum in Russian from Joseph Stalin about Opening a Second Front in Europe during World War II, with English Translation of Same’. 13 August 1942. Library of Congress, Manuscript Division. https://www.loc.gov/item/mcc.077/.
Stalin, J. V. ‘The Tasks of Business Executives’. In J. V. Stalin Collected Works, vol. 13. Foreign Languages Publishing House, 1954.
State Council Information Office [国务院新闻办公室]. ‘新闻办吹风会介绍“抗日战争时期中国人口伤亡和财产损失”调研成果情况和二战中中国贡献的最新理论研究成果 [News Briefing on Research Findings on Chinese Casualties and Property Losses During the War of Resistance Against Japanese Aggression and the Latest Theoretical Research on China’s Contribution in World War II]’. Chinese Government Website [中国政府网], 14 July 2015. https://www.gov.cn/xinwen/zb_xwb77/.
State Council Information Office [国新办新闻发布会]. ‘国新办举行抗战时期中国伤亡、财产损失及贡献等研究成果吹风会 [The State Council Information Office held a press briefing on research findings regarding Chinese casualties, property losses, and contributions during the Anti-Japanese War period]’. 国新办新闻发布会 [State Council Information Office], 1 July 2015. http://www.scio.gov.cn/xwfb/gwyxwbgsxwfbh/wqfbh_2284/2015n_9477/2015n07y14r/.
Statista. ‘Population of the Soviet Union 1941 and 1946’. 31 December 2015. https://www.statista.com/statistics/1260605/soviet-population-changes-wwii-gender-age/?srsltid=AfmBOoq1eA8m43U8D4YjIahdJvpxnzGjd6I3v6Oq63HCkC63yC46Y1qr.
Statista. ‘WWII: Share of Total Population Lost Per Country 1939–945’. Chart. 2024. https://www.statista.com/statistics/1351638/second-world-war-share-total-population-loss/.
Stimson, Henry L. ‘Stimson Diary Entries, May 14 and 15, 1945’. National Security Archive. Accessed 10 October 2025. https://nsarchive.gwu.edu/document/28513-document-12-stimson-diary-entries-may-14-and-15-1945.
Taira, Yoshitoshi [平良好利]. Okinawa’s Inconvenient Truths. The Tokyo Foundation, 2015. https://www.tokyofoundation.org/research/detail.php?id=617.
Tanaka, Toshiyuki [田中利幸]. Hidden Horrors: Japanese War Crimes World War II. Lanham, MD: Rowman & Littlefield, 2018.
The National Archives. ‘Operation Unthinkable’. Text. The National Archives, 2 May 2020. https://www.nationalarchives.gov.uk/education/resources/cold-war-on-file/operation-unthinkable/.
The National Committee for Investigation of the Truth About the Jeju April 3 Incident. The Jeju 4.3 Incident Investigation Report. Jeju 4.3 Peace Foundation, 2014. www.jeju43peace.or.kr.
The National WWII Museum New Orleans. ‘Research Starters: Worldwide Deaths in World War II’. Accessed 29 September 2025. https://www.nationalww2museum.org/students-teachers/student-resources/research-starters/research-starters-worldwide-deaths-world-war.
The New York Times. ‘Text of Gromyko’s Statement on the Peace Treaty’. Archives. The New York Times, 9 September 1951. https://www.nytimes.com/1951/09/09/archives/text-of-gromykos-statement-on-the-peace-treaty-contrast-with-other.html.
The Presidential Library, Russian Federation. ‘Presidential Library’s Materials Spotlight the Evacuation of Industry in Besieged Leningrad’. Presidential Library, 20 November 2020. https://www.prlib.ru/en/news/1305280.
The Presidential Library, Russian Federation. ‘New Documents Entered the Collection of Digitised Archival Documents, Film and Photo Materials Dedicated to World War II’. Presidential Library, 1 July 2022. https://www.prlib.ru/en/news/1343410.
The United States Strategic Bombing Surveys: European War, Pacific War. The United States Strategic Bombing Surveys, 1946.
Tipton, Elise K. The Japanese Police State: The Tokkô Interwar Japan, Facsim. ed. London: Bloomsbury Academic, 2012.
Tokumoto, Eiichiro [徳本栄一郎]. ‘Boiling Point’. Number 1 Shimbun, August 2023. https://www.fccj.or.jp/number-1-shimbun-article/boiling-point.
Treaty of Peace with Japan (with Two Declarations), Signed at San Francisco, on 8 September 1951, in United Nations Treaty Series, vol. 136, No. 1832, 46 (1951). https://treaties.un.org/doc/publication/unts/volume%20136/volume-136-i-1832-english.pdf.
Truman, Harry S. ‘Diary Note of President Harry S. Truman’. 1945. President’s Secretary’s Files (Truman Administration), 1945–1953; File: Truman, Harry S.: Diary, 1947–1952. Harry S. Truman Library. https://catalog.archives.gov/id/183568377.
Tschoegl, Adrian E. ‘Foreign Banks in Japan’. BOJ Monetary and Economic Studies 6, no. 1 (1988).
Tsvetkova, Natalia [Наталья Цветкова], Ivan Tsvetkov [Иван Цветков], and Irina Barber. ‘Americanisation Versus Sovietisation: Film Exchanges Between the United States and the Soviet Union, 1948–1950’. Cogent Arts & Humanities 5, no. 1 (2018). https://doi.org/10.1080/23311983.2018.1471771.
United Nations Economic and Social Commission for Asia and the Pacific. Population of the Republic of Korea. E/CN.11/1241. ESCAP Country Monograph Series. United Nations Economic and Social Commission for Asia and the Pacific, 1975.
United States Department of State. ‘Protocol of the Proceedings of the Crimea Conference’. In Foreign Relations of the United States: Diplomatic Papers, The Conferences at Malta and Yalta, 1945. United States Government Printing Office, 1955. https://history.state.gov/historicaldocuments/frus1945Malta/d503.
United States Department of State. ‘Memorandum Economic Assistance Program for China’. In Foreign Relations of the United States, 1948, The Far East: China, vol. 8. United States Government Printing Office, 1948. 893.50 Recovery/2–2048. https://history.state.gov/historicaldocuments/frus1948v08/d403.
United States Office for Emergency Management, United States Foreign Economic Administration, and United States Department of State. Twenty-First Report to Congress on Lend-Lease Operations, For the Period Ended September 30, 1945. Congressional Report H. Doc. 382. 79th Cong., 2d Sess. US Government Printing Office, 1946. https://fraser.stlouisfed.org/title/report-congress-lend-lease-operations-9400/twenty-first-report-congress-lend-lease-operations-687771.
United States Senate, Committee on Armed Services and Committee on Foreign Relations. Military Situation in the Far East: Hearings Before the Committee on Armed Services and the Committee on Foreign Relations, United States Senate, Eighty-Second Congress, First Session, to Conduct an Inquiry into the Military Situation in the Far East and the Facts Surrounding the Relief of General of the Army Macarthur from His Assignments in That Area. 82d Cong., 1st Sess. US Government Printing Office, 1951. https://catalog.hathitrust.org/Record/001606736.
United States Senate. Military Situation in the Far East: Hearings Before the Committee on Armed Services and the Committee on Foreign Relations, United States Senate, Eighty-Second Congress, First Session. Congressional Hearings No. 153797. 82d Cong., 1st Sess. US Government Printing Office, 1951. https://catalog.hathitrust.org/Record/001606736.
US National Archives and Records Administration. ‘Records of the Secretary of Defense (RG 330)’. National Archives, 11 October 2016. https://www.archives.gov/iwg/declassified-records/rg-330-defense-secretary.
Valerʹevich Isaev, Alekseĭ [Алексей Валерьевич Исаев]. Stalingrad: City on Fire. Barnsley, South Yorkshire, UK Havertown, PA, USA: Pen & Sword Military, 2019.
Veblen, Thorstein, and Leon Ardzrooni. Essays Our Changing Order. New York: Viking Press, 1934.
Vietnam Veterans of America. ‘Vietnam War Statistics’. Accessed 29 August 2025. https://www.vva310.org/vietnam-war-statistics#top.
Virtual Museum of the Spanish Civil War. ‘The International Brigades’. In Virtual Museum of the Spanish Civil War. Virtual Museum of the Spanish Civil War. Accessed 1 September 2025. https://www.vscw.ca/en/node/699.
Wachsmann, Nikolaus. KL: A History of the Nazi Concentration Camps, 1st edition. New York: Farrar, Straus and Giroux, 2015.
Wallace, Max. The American Axis. New York: St. Martin’s, 2005.
Warner, Michael. ‘Origins of the Congress of Cultural Freedom, 1949–50 Cultural Cold War’. Studies in Intelligence 38, no. 5 (1995).
Washington Editors. ‘What the State Thinks – Hitler Appraised’. The Seattle Sunday Times (Seattle, WA), 24 March 1933.
Weitz, Eric D. Creating German Communism, 1890–1990: From Popular Protests to Socialist State. Princeton, NJ: Princeton University Press, 1997.
Werth, Alexander, and Nicolas Werth. Russia at War, 1941–1945: A History. New York: Skyhorse Publishing Company, Incorporated, 2017.
Wheeler-Bennett, John W. King George VI: His Life and Reign. New York: St. Martin’s Press, 1958.
White, Geoffrey M., Lisa Yoneyama, and Takashi Fujitani. Perilous Memories: The Asia-Pacific War(s). Durham, NC: Duke University Press, 2001.
Williams, Susan. ‘Introduction: The Manhattan Project and Shinkolobwe’. In Spies in the Congo: The Race for the Ore That Built the Atomic Bomb. Hurst & Company, 2018.
Wistrich, Robert S. Who’s Who Nazi Germany, 2nd edition. London: Routledge, 2001.
Woolfson, Shivaun. Holocaust Legacy Post-Soviet Lithuania: People, Places, and Objects. London: Bloomsbury, 2014.
Xi, Jinping [习近平]. ‘习近平在纪念中国人民抗日战争暨世界反法西斯战争胜利70周年大会上的讲话_中华人民共和国外交部 [Speech at the Commemoration of the 70th Anniversary of Victory in the Chinese People’s War of Resistance Against Japanese Aggression and the World Anti-Fascist War]’. Speech. Beijing, 3 September 2015. https://www.mfa.gov.cn/web/ziliao_674904/zyjh_674906/201509/t20150903_9869606.shtml.
Xinhua News Agency [新华社]. ‘永远做中华民族文明成果与人类和平事业的捍卫者 – 写在中国人民抗日战争暨世界反法西斯战争胜利80周年之际 [Always Be a Defender of the Achievements of Chinese Civilization and the Cause of Human Peace – Written on the Occasion of the 80th Anniversary of the Victory of the Chinese People’s War of Resistance Against Japanese Aggression and the World Anti-Fascist War]’. Government Website. The Supreme People’s Procuratorate of the People’s Republic of China [中华人民共和国最高人民检察院], 29 August 2025. https://www.spp.gov.cn/spp/tt/202508/t20250829_704946.shtml.
Xu, Lan [徐蓝]. ‘百年巨变中的中国人民抗日战争暨世界反法西斯战争 [The Chinese People’s War of Resistance Against Japan and the World Anti-Fascist War in the Context of Unprecedented Changes in a Century]’. Studies of the War of Resistance Against Japan [抗日战争研究] 2025, no. 1 (2025). http://jds.cssn.cn/xscg/xslw/202505/t20250523_5875447.shtml.
Xu, Ping [徐平]. ‘说说抗战时期八路军伙食 [Talking About the Eighth Route Army’s Rations During the War of Resistance]’. China Military Online [中国军网], 11 January 2024. http://www.81.cn/js_208592/jdt_208593/16279996.html.
Zaloga, Steve. Bagration, 1944: The Destruction of Army Group Centre. London: Osprey, 1996.
Zaloga, Steven J. T-34/76 Medium Tank 1941–45. Oxford: Osprey Publishing, 1994.
Zaloga, Steven J., and Peter Sarson. KV-1 and 2 Heavy Tanks 1939–45, 1st edition. London: Bloomsbury Publishing Plc, 1996.
Zhang, Weidong [张卫东]. ‘Speech by Ambassador Zhang Weidong at the Seminar in Commemoration of the 70th Anniversary of the Victory of the War of Resistance against Japanese Aggression of China and the World Anti-Fascist War’. 28 August 2015. https://www.mfa.gov.cn/eng/zy/jj/2015zt/jnkzsl70zn/202406/t20240606_11381447.html.
Zhang, Yu. ‘From Beneath the Ground Rise Great Stories of Ingenuity and Defiance’. China Daily, 22 August 2025. https://www.chinadaily.com.cn/a/202508/22/WS68a7b10ca310851ffdb4f6e6.html.
Zhang, Zeyu [张泽宇]. ‘全面抗战时期苏联和共产国际对中共的援助研究 [A Study of the Aid to the CPC from the Soviet Union and the Communist International During the Full-Scale War against Japanese Aggression]’. CPC History Studies [中共党史研究], no. 8 (2011).
Zhang, Zeyu [张泽宇]. ‘不可虚无苏联反法西斯的贡献 [The Soviet Union’s Contribution to the Anti-Fascist Struggle Cannot Be Negated]’. Historical Review [历史评论], no. 4 (2025).
As we commemorate eighty years since the people’s victory in the World Anti-Fascist War, we must remember who truly saved humanity – and honour their sacrifice with the truth. Read More